|
A full file system can lead to performance degradations and critical loss of data. To prevent such problems, administrators need to monitor the Available Capacity and the Available Capacity Percentage parameters of the Volume class on each filer to diagnose which filer constitutes the performance bottleneck.
| 1. | In the Status tab, click: |
| • | Aggregate > Volume (C-Mode) |
| • | Cluster > Vserver > Volume (C-Mode) |
| • | Storage System > vFiler > Volume (7-Mode) |
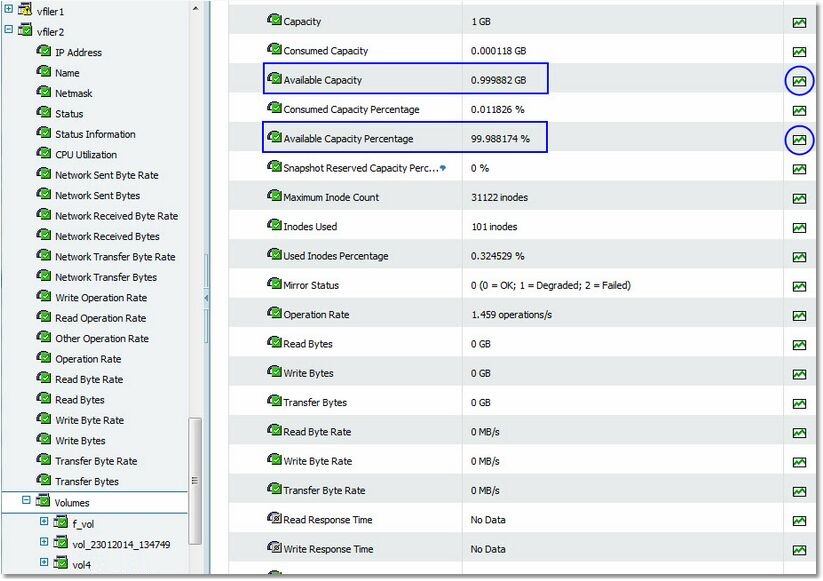
Available capacity in a volume of a NetApp Filer
| 2. | Click the History icon to automatically display a graph that shows the available capacity in gigabytes and the available capacity percentage values collected during the previous six hours. You can customize the chart and table to show parameter history for different time periods. |
| 

