|
Parameters for which values are cumulative are generally only representative when considered for a specific period of time. Those values are therefore mostly unusable when displayed in the Status tab of the Portal, since they represent a static number of data collected since the last polling. The value consequently changes a lot depending on the exact polling period.
A rather more meaningful way to view cumulative-value parameters would be to create a report to visualize these values on a hourly or daily basis in total (how many gigabytes have been transmitted each day, for example).
| 2. | Select the NetApp Filer for which you want to obtain received and transmitted data values |
| 3. | Select 2 in the Number of Charts to Display option |
| 4. | Select for the Network Transfer Bytes (GB) parameter for the first chart and Disk Transfer Bytes (GB) for the second chart |
| 5. | Define the period of time for which you want to display the values |
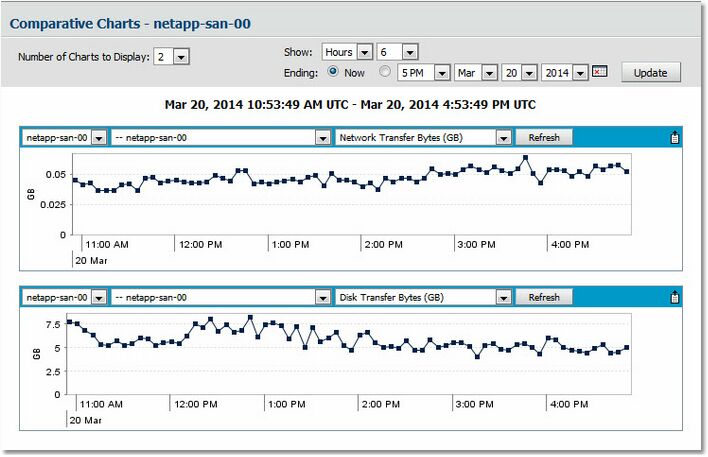
Network and Disk Transfer Bytes Data Report
| 

