Verifying the Activity Generated by a LUN


Verifying the Activity Generated by a LUN |
|
|
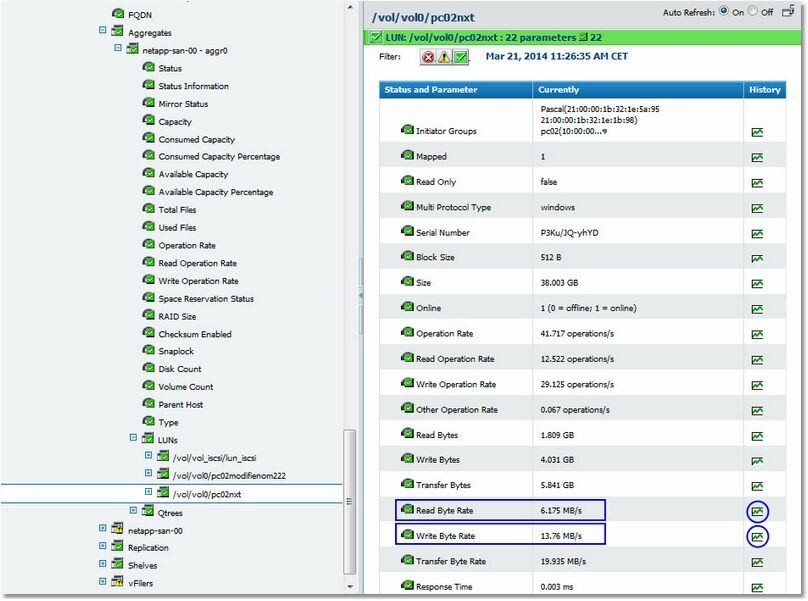
In order to understand the high activity of a filer, it is important to identify the LUNs generating the heaviest I/Os. The SAN administrator can then check with the system administrator whether the reported activity may be considered a normal behavior. The Read Byte Rate and Write Byte Rate parameters of the LUN instances expose the data throughput for each LUN. Use these parameters to report on the total data traffic (per hour or per day) on each LUN in GB.
to display the Read/Write Byte Rate parameters.
Selecting a NetApp Filer's LUNs Read/Write Byte Rate Parameter
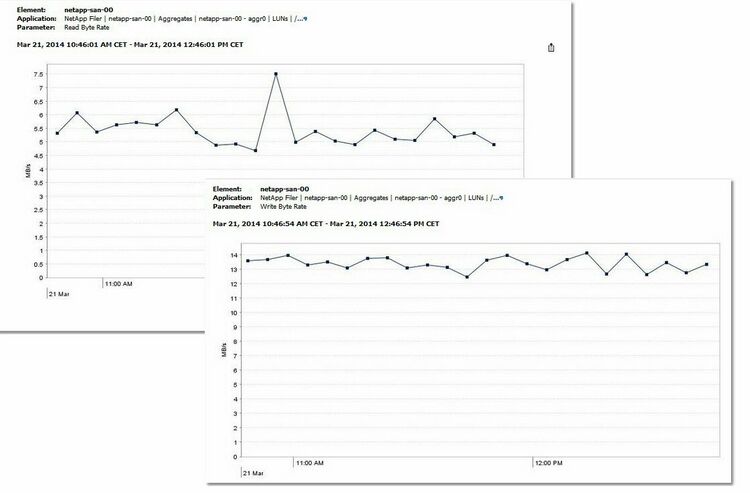
Viewing a NetApp Filer's LUNs Read/Write Byte Rate as a graph See also |