Monitoring Hardware Components


Monitoring Hardware Components |
|
|
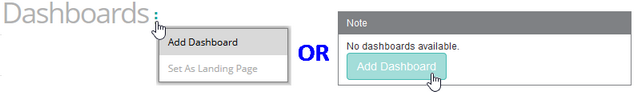
Hardware failures are responsible for approximately half of IT system outages. Left unchecked, resource consumption make identifying issues (battery run downs, excessive heat, power fluctuations, etc.) challenging. Monitoring hardware health can help minimize server and application downtime and reduce business risks. To diagnose and predict hardware components failures, you will need to create a three-column dashboard that reports on the elements that are most likely to fail in a storage system. This topic illustrates how to monitor batteries, fans, and power supplies for two storage systems. Dashboards allows you to gather specific types of data and display them in a consolidated graphical format. For detailed information about dashboards options and features, refer to the BMC documentation. To Monitor Hardware Components1.Login to your BMC TrueSight Operations Management console. 2.Select Dashboards from the navigation pane. 3.In the Dashboards page, click Add Dashboard or select Add Dashboard from the dashboard action menu
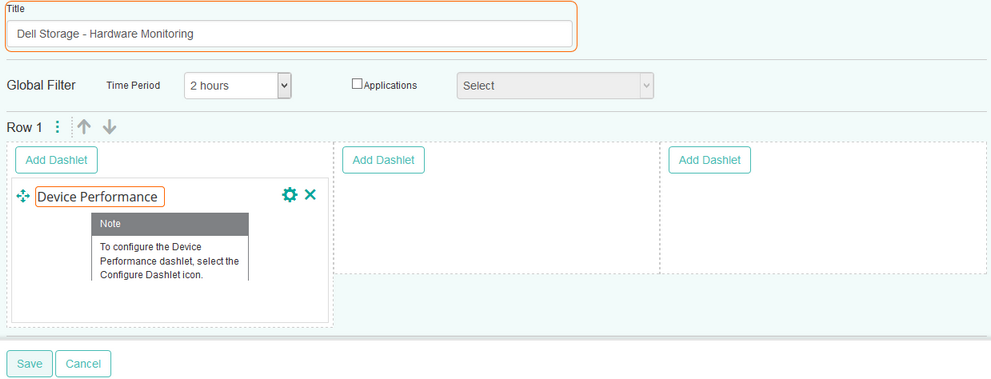
4.Enter a Title for your dashboard and configure a Global Filter, if needed. 5.Click Add Dashlet to open the dashlet library for the first column of the row. 6.From the dashlet library, select the Device Performance template, and then click Close.
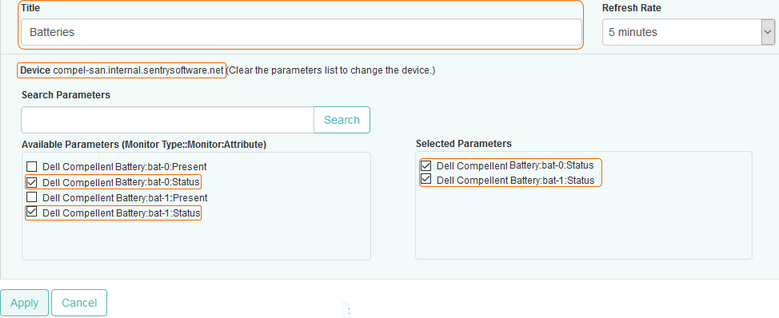
7.Select Configure Dashlet by clicking the 8.In the panel of input fields and options that opens below the dashboard, enter a Title for the dashlet and specify a Refresh Rate (default is 5 minutes). 9.Select the Dell storage device for which you to compare physical disks I/Os. 10.Select the Status parameter of the batteries of the storage system and click Apply.
11.Repeat step 4 to 8 in the second column of the dashboard for the fans. •Select the Status parameters of the fans of the storage system and click Apply.
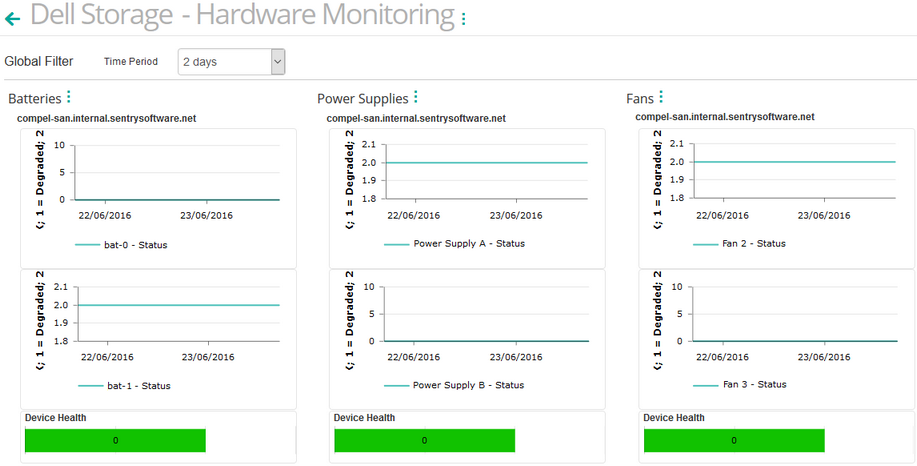
12.Finally, configure the dashlet of the third column of the dashboard to monitor the storage system power supply. Repeat step 4 to 8. •Select the Status parameters of the power supplies of the storage system and click Apply. 13.Click Save. 14.The dashboard is completed and shows the status of batteries, fans and power supplies of the storage system.
Related Topics Monitoring your Storage Environment |