|
Monitoring volumes to find out if the amount of data processed is dangerously growing close to the volume's limit will help you not being caught short of space without warning.
To identify the volumes that generate the most traffic, you will need to create a simple three-column dashboard. Dashboards allow you to gather specific types of data and display them in a consolidated graphical format. For detailed information about dashboards options and features, refer to the BMC documentation.
To Identify Busiest Volumes
| 1. | Login to your BMC TrueSight Operations Management console. |
| 2. | Select Dashboards from the navigation pane. |
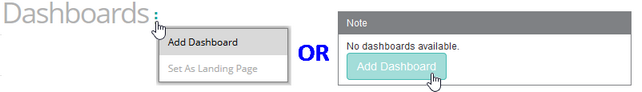
| 3. | In the Dashboards page, click Add Dashboard or select Add Dashboard from the dashboard action menu  . . |
| 4. | Enter a Title for your dashboard and configure a Global Filter, if needed. |
| 5. | Click Add Dashlet to open the dashlet library for the first column of the row. |
| 6. | From the dashlet library, select the Device Performance template, and then click Close. |
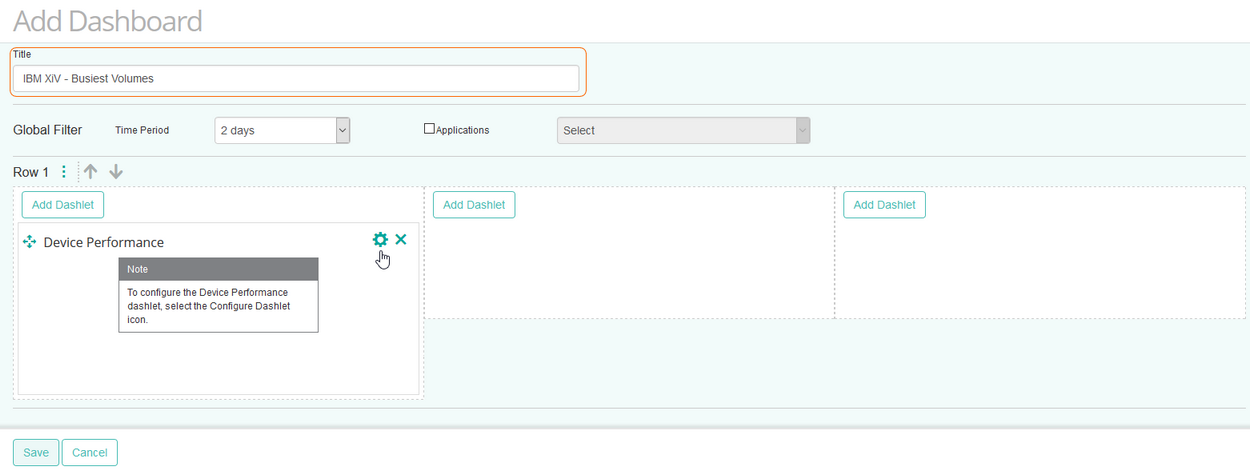
| 7. | Select Configure Dashlet by clicking the  button. button. |
| 8. | In the panel of input fields and options that opens below the dashboard, enter a Title for the dashlet and specify a Refresh Rate (default is 5 minutes). |
| 9. | Select the IBM XiV storage device for which you want to compare volume traffic. |
| 10. | Select the Read Byte Rate and the Write Byte Rate parameters for the first volume, and click Apply. |
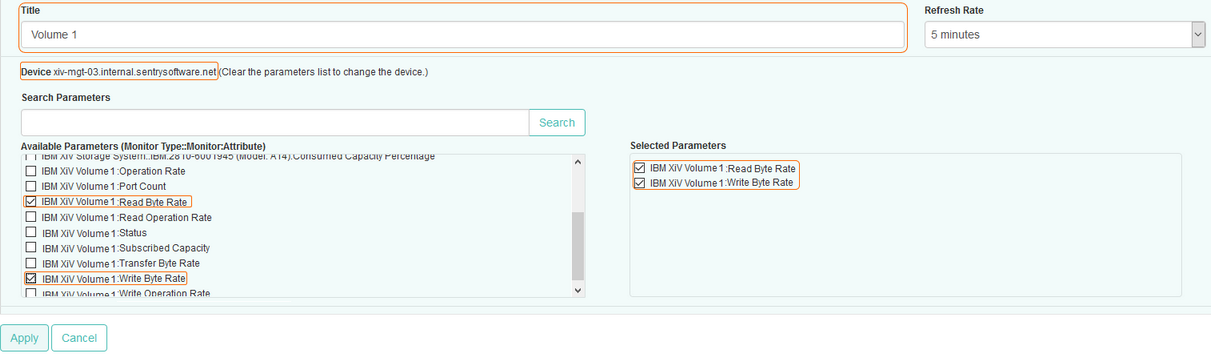
Tip
To quickly retrieve a component or a parameter, enter its name in the Search Parameters field and click Search.
|
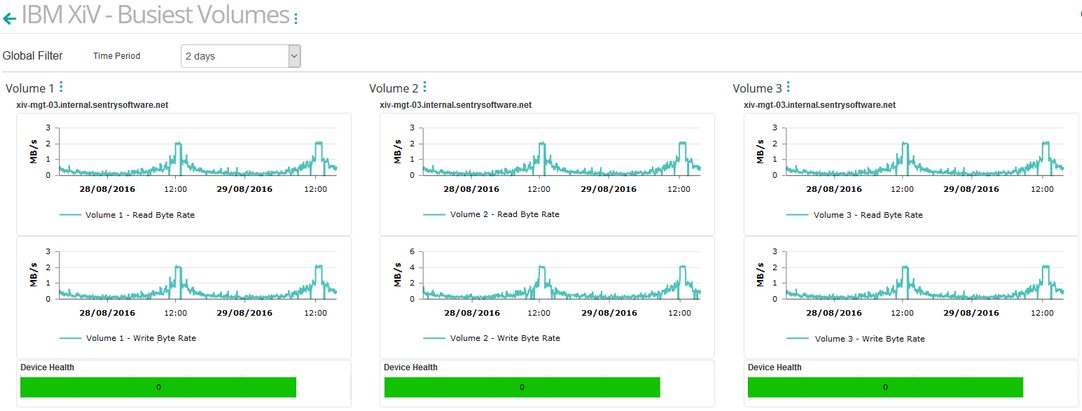
| 11. | Repeat this operation in the next columns of the dashboard for other volume and click Save. |
| 12. | The dashboard is completed and shows the Read Byte Rate and the Write Byte Rate for the three selected volumes. |
Related Topics
Monitoring your Storage Environment
Creating Consolidated Data Views with Dashboards
IBM XiV Volume
|


