Monitoring Processes


Monitoring Processes |
|
|
Monitoring processes on a regular basis helps you ensure that a computer runs at peak efficiency and that it carries out its appointed tasks as expected. For example, by monitoring processes you can be notified immediately of any application that has stopped responding, and then take steps to end that process. In addition, process monitoring enables you to identify problems before they occur. For example, by repeatedly checking the amount of memory used by a process, you can identify a memory leak. You can then stop the process before the errant application uses all of the available memory and brings the computer to a halt. The Microsoft Search KM for PATROL automatically monitors all of the processes related to the targeted search engine. The monitoring of a process returns the following parameters, in the PATROL console: •HandleCount: Number of handles opened by the process. •PercentProcessorTime: Percentage of used processor time •PrivateBytes: Memory usage of the process, excluding memory regions shared with other processes. This counter is a good indicator of the overall memory consumption of the process. •WorkingSet: Working set size of the process.
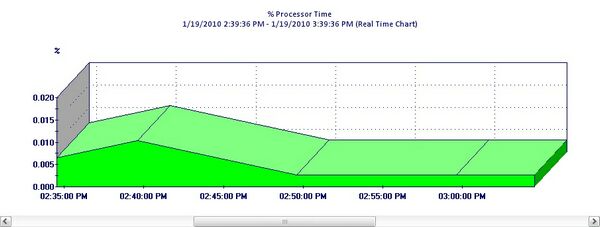
Double-click a parameter to draw a graph based on the parameter's data:
Graph – Percentage of Processor Time
|