- Prerequisites
- Upgrading
- Importing
- Using
- Verifying that your IT infrastructure is fully monitored
- Monitoring the agent collection status
- Observing the hardware health of the monitored hosts
- Detecting hardware failures
- Reporting the energy usage and carbon emissions of your infrastructure
- Spotting the top consumer sites
- Optimizing the ambient temperature in the data center
- Estimating potential savings per site
-
Home
- Integrations Prometheus/Grafana 2
Grafana Dashboards
The Hardware Sentry - Main, Hardware Sentry - Site, and Hardware Sentry - Host dashboards give you immediate visibility into your monitored environment. The organized panels expose health metrics for all monitored systems and bring real-time metrics and projected trends on electricity consumption and costs, as well as CO₂ emissions for your entire infrastructure. Once you have imported the dashboards, they are automatically available from the Dashboard menu on the Home page.

Prerequisites
Before using the dashboards, you must have:
- configured the Hardware Sentry Agent
- configured the Prometheus Server
- run both Hardware Sentry and the Prometheus server.
Upgrading
If you are using Hardware Dashboards for Grafana v1 or Hardware Dashboards for Grafana v2, which were previously available from Sentry Software's Website, first delete the following folders on the Grafana server:
provisioning: this folder is generally located inC:\Program Files\GrafanaLabs\grafana\confon Windows,/etc/grafanaon LinuxHardware Sentry: this folder is generally located inC:\Program Files\GrafanaLabs\grafana\public\dashboardson Windows,/var/lib/grafana/dashboardson Linux.
Then log on to Grafana, go to Dashboards > Browse and delete the Sustainable_IT or Hardware Sentry folder.
Restart the Grafana server before importing the dashboards.
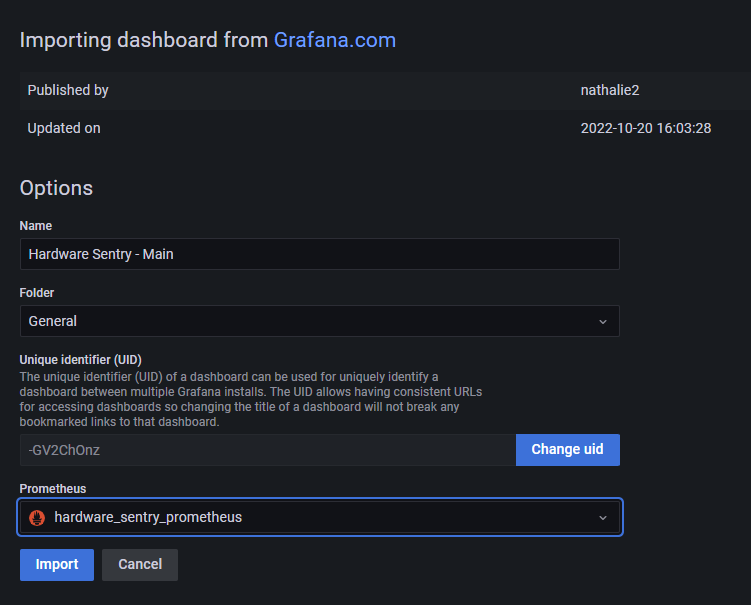
Importing
-
Log on to Grafana
-
Import the dashboard(s)
-
In the Import via grafana.com field, enter:
17223for the Hardware Sentry - Main dashboard17229for the Hardware Sentry - Site dashboard17230for the Hardware Sentry - Host dashboard
-
Select the Prometheus datasource
-
Click Import
-
Repeat the procedure to import all the Hardware Sentry dashboards.

The Hardware Sentry dashboards are now loaded in Grafana:
| Dashboard | Description |
|---|---|
| Hardware Sentry - Main | Overview of all monitored sites |
| Hardware Sentry - Site | Metrics associated to one site (a data center or a server room) and its monitored hosts |
| Hardware Sentry - Host | Metrics associated to one host and its internal components |
Using
Verifying that your IT infrastructure is fully monitored
The Coverage panel available in the Overall Information section of the Hardware Sentry - Main dashboard indicates the percentage of hosts that are actually monitored.

A host is considered as not monitored if no connectors match the configured system. If the value displayed is below 100%, open each Site to identify the hosts for which no data is available. Then access each host page and check the status of the configured Protocol(s) and matching Connector(s):

If their status is not OK, open the corresponding config/hws-config.yaml file and verify the host configuration. If you manually specified the connectors to be used, check the selectedConnectors and excludedConnectors parameters (See Configuring the Hardware Sentry Agent).
Monitoring the agent collection status
The Hardware Sentry Agent Status panel, at the bottom of the Hardware Sentry - Main dashboard, lists all the agents configured to collect data, by sites. This panel enables you to view the agents' hostnames, and verify that the agent and connector versions are up-to-date. The Last Seen column indicates the last time an agent was seen during the past 6 hours. An agent going undetected for more than 2 minutes may indicate a potential problem with the host, the connection or the agent configuration.

Observing the hardware health of the monitored hosts
The Hardware Sentry - Host dashboard provides the essential hardware health and sustainability data available for the monitored host:
- the status of its internal components
- the network traffic
- the storage usage
- the power consumption and related carbon emissions
- the temperature information
- etc.

Information about the monitoring itself (host information, connectors used, etc.) is provided in the Monitoring Information panel.

Detecting hardware failures
The Hardware Sentry - Main and Hardware Sentry - Site dashboards provide the number of Critical Alerts and Warning Alerts detected by Hardware Sentry. Additional information about the Current Alerts is provided in the Hardware Sentry - Main and Hardware Sentry - Host dashboards.

Reporting the energy usage and carbon emissions of your infrastructure
The Power, Cost, and CO₂ emissions section of the Hardware Sentry - Main dashboard reports how much kWh your infrastructure consumes daily, monthly, and yearly, the associated cost and carbon emissions.

The accuracy of this information is provided with the Margin of Error. A lower Margin of Error means a more accurate estimation.
Spotting the top consumer sites
You can spot the top consumer server rooms in the Sites section of the Hardware Sentry - Main dashboard by referring to the Total Power column. This column displays the total power consumption of all hosts in a site.

Once you have identified the top consumer sites, you can scroll down to the Top Consumers panel available in the Power and Host Information section to find out the top ten hosts that consume the most electricity across your entire infrastructure.

Note: The data is automatically refreshed according to the defined collection interval (By default: 2m).
This information can help you implement the best strategy for efficiency, such as replacing older equipment with more efficient ones or moving servers to a site with a lower electricity cost.
Click on one of the histogram's bar to drill down to the host level and get detailed information about a specific device.
Optimizing the ambient temperature in the data center
Data centers are energy-intensive facilities. This energy is converted into heat that must be dissipated away from the equipment racks to maintain an optimal room temperature. Therefore, the hardware devices' temperature is a critical parameter that must be closely monitored.
In most data centers, the air conditioning system ensures the entire room’s ambient temperature is maintained at 65 degrees Fahrenheit (18 degrees Celsius), which is generally unnecessarily low to avoid overheating problems. Computer systems can safely operate with an ambient temperature significantly higher (see Google’s example, where they raised the temperature of their data centers to 80°F, i.e. 26.7°C). This is the fastest and cheapest method to reduce the energy consumed by a data center and improve its PUE.
From the Sites section of the Hardware Sentry - Main dashboard, refer to the Ambient Temperature column to spot the warmer sites. From cold blue to warm red, the color code helps you rapidly identify the sites where the overall temperature can be optimized.

The Heating Margin column exposes the number of degrees Celsius (°C) remaining before the temperature reaches the closest warning temperature threshold of a monitored host for each monitored site.
Note: Some hardware devices do not expose their overall temperature and are therefore not included in the heating margin computation. Hardware Sentry provides the percentage of the Monitoring Confidence per site in the Site dashboard.
Scroll down to the Hosts Temperatures section to assess the ambient temperature per host and identify the hosts that report the highest temperature.

These indicators can help you optimize your overall data center's ambient temperature by acting at the site or the host's level. Increasing the ambient temperature in a facility by 1 degree Celsius can lower your electricity consumption and reduce your carbon emission by 5%, based on an average PUE of 1.80 (default).
Estimating potential savings per site
The Site Temperature Optimization panel exposes detailed information about the heating margin for a specific site, including the temperature collected by hosts. This panel is particularly interesting to estimate the savings you could make if you increase the temperature of your facilities to the Recommended Site Temperature and how you can significantly reduce the carbon footprint of a site.

Note that the accuracy of the estimated values increases proportionally with the Monitoring Confidence percentage. This percentage is based on the number of hosts reporting temperature readings. The higher the number of hosts reporting temperature readings, the higher the confidence.