Detecting High Processor Utilization


Detecting High Processor Utilization |
|
|
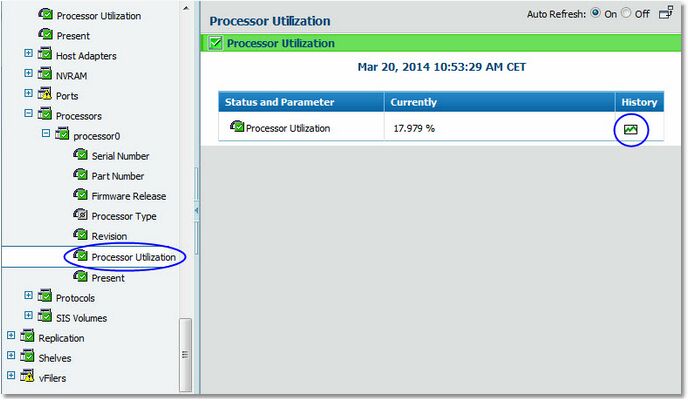
A processor overload can lead to unpredictable performance degradations in a filer. To prevent such problems, administrators need to monitor the Processor Utilization parameter on each filer to diagnose whether the filer processor constitutes the performance bottleneck.
to display the current value for the Processor Utilization parameter.
Selecting a NetApp Filer's Processor Utilization Parameter
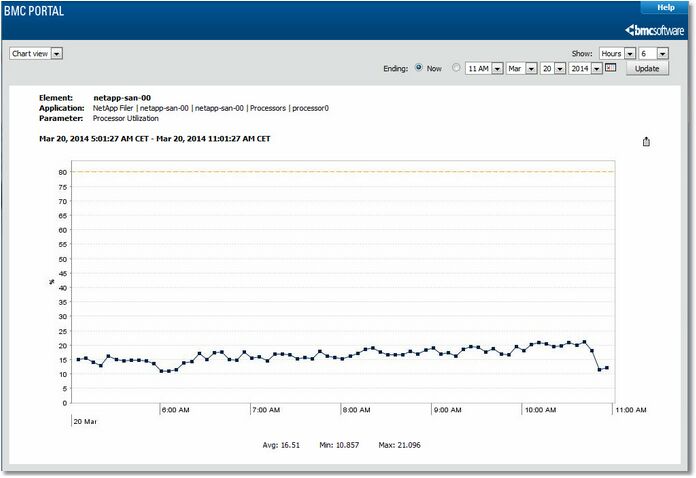
Viewing a NetApp Filer's Processor Utilization as a graph A processor utilization over 80% means that this processor is overloaded and that it constitutes a bottleneck for the filer. By default, the Processor Utilization parameter will display a warning when reaching 80% and an alert when reaching 90 %. You can easily modify these thresholds in the Thresholds page.
|