Detecting High Processor Utilization


Detecting High Processor Utilization |
|
|
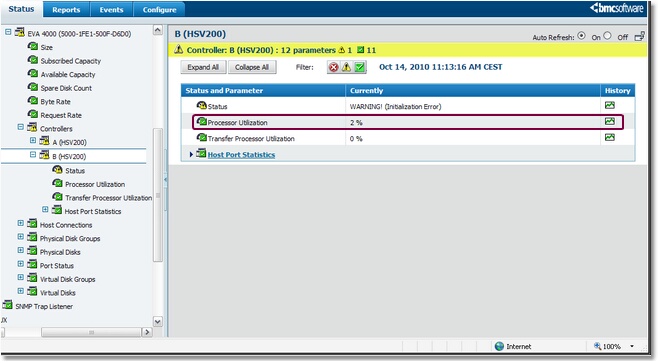
A storage controller overload can lead to unpredictable performance degradations in a disk array. To prevent such problems, administrators need to monitor the processor utilization on each controller to identify which one may potentially become a bottleneck.
Selecting a Controller's Processor Utilization Parameter
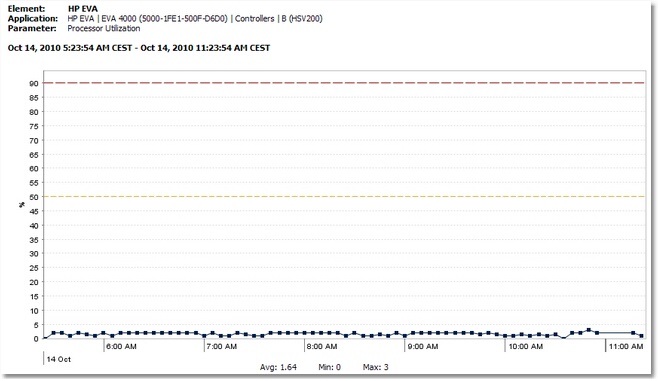
Viewing a Controller's Processor Utilization as a Graph A processor utilization over 80% means that this controller is overloaded and that the controller constitutes a bottleneck for the disk array. Also, it is also usually considered that a processor average utilization above 50% on both controllers constitutes an important risk as one single controller wouldn't be able to handle the entire load of the disk array in case of a controller fail over. That's why a warning threshold is set at 50%. See also |