Diagnosing Fiber Performance Issues

Home  Previous  Next

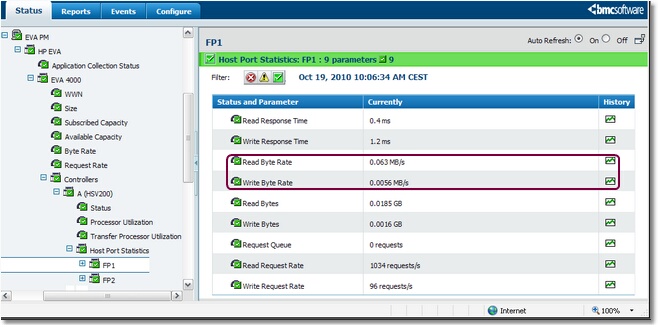
Each external data port is represented by a Host Port Statistics instance. The parameters of this class provide an accurate picture of the traffic on each fiber link. This will notably help administrators identify which port constitutes a bottleneck or diagnose 'multi-pathing' issues.

1.Create a graph with the Read Byte Rate and Write Byte Rate parameters to visualize the traffic on each fiber port (host ports only). In the console, double-click a Controller's icon > Host Port Statistics > Fiber Ports > Read Byte Rate to create a graph with the Read Byte Rate value.

TREE_FP_Performance

Selecting a Fiber Port's Read Byte Rate and Write Byte Rate Parameters

2.Select the Write Byte Rate parameter and drag it from the tree view of the Operator tab to the graph. The second parameter is automatically added to the first one to facilitate the comparison of the fiber port performance.

GRAPH_FP_Performance

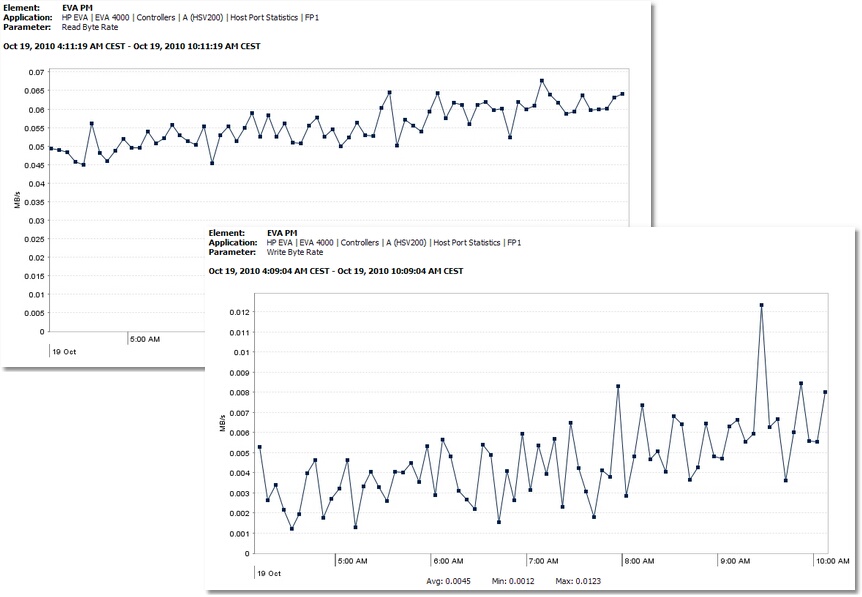
Comparing a Fiber Port's Read Byte Rate and Write Byte Rate Parameters