Checking Disks Health


Checking Disks Health |
|
|
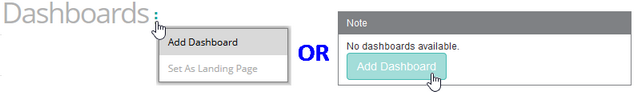
Manufacturers use the “mean time to failure” or MTTF to indicate the operational reliability of their products. But the advertised MTTF of 1,000,000 hours is misleading. Recent studies show that the average annual replacement rate for hard disks is typically between 3% and 15%. Because a disk failure can result in loss of data, unavailability and performance degradation, it is highly recommended to monitor disks health. To check Dell disks health, you will need to create a simple two-row dashboard. Dashboards allow you to gather specific types of data and display them in a consolidated graphical format. For detailed information about dashboards options and features, refer to the BMC documentation. To verify disks health1.Login to your BMC TrueSight Operations Management console. 2.Select Dashboards from the navigation pane. 3.In the Dashboards page, click Add Dashboard or select Add Dashboard from the dashboard action menu
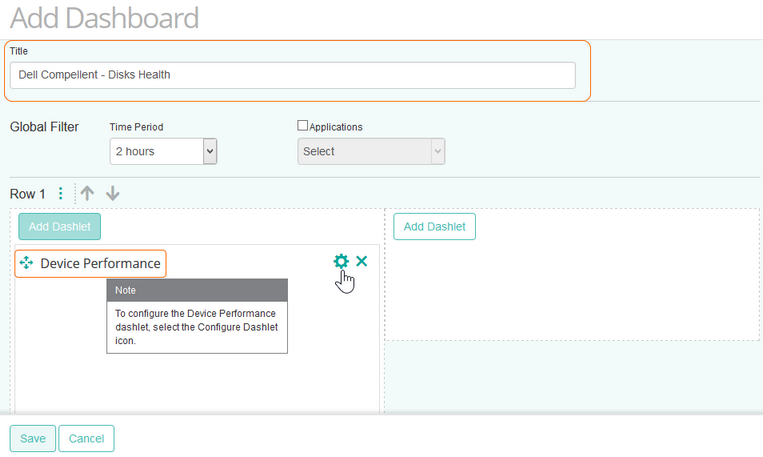
4.Enter a Title for your dashboard and configure a Global Filter, if needed. 5.Click Add Dashlet to open the dashlet library for the first column of the row. 6.From the dashlet library, select the Device Performance template, and then click Close.
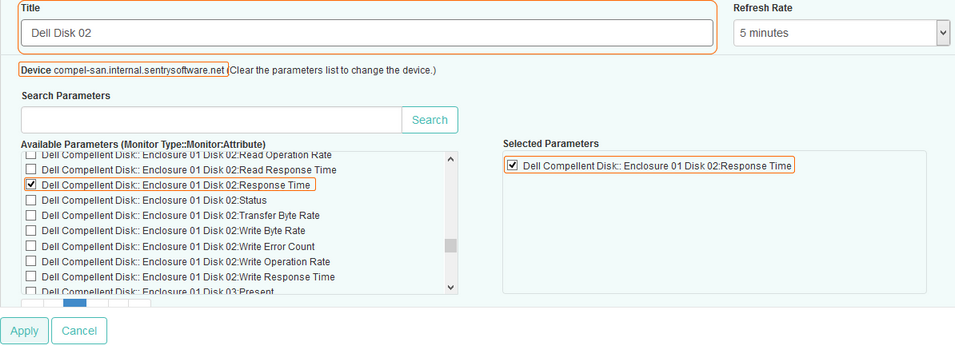
7.Select Configure Dashlet by clicking the 8.In the panel of input fields and options that opens below the dashboard, enter a Title for the dashlet and specify a Refresh Rate (default is 5 minutes). 9.Select the Dell storage device for which you to monitor disks health. 10.Select the Response Time parameter for the first disk, and click Apply.
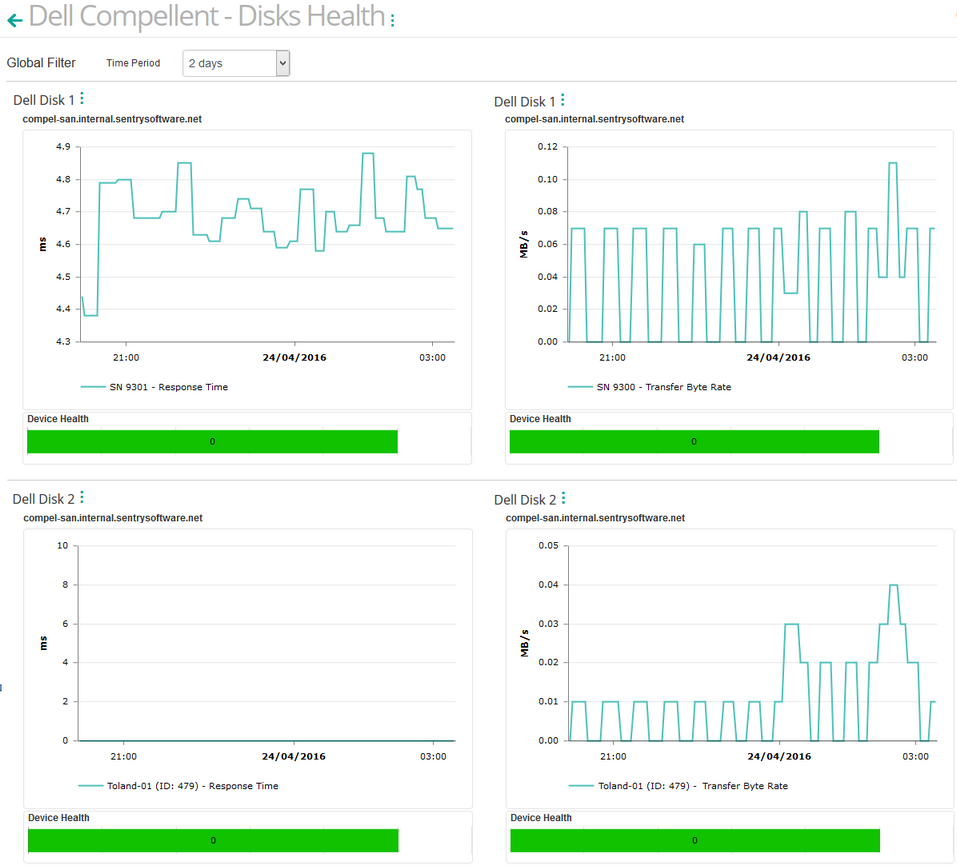
11.In the second column of the dashboard click the 12.Select the Transfer Byte Rate parameter for the disk you have initially chosen, and click Apply. 13.Repeat this operation in the next row of the dashboard for another disk and click Save. 14.The dashboard is completed and shows the Response Time and the Transfer Byte Rate parameters for both disks.
Related Topics Monitoring your Storage Environment Creating Consolidated Data Views with Dashboards
|