Diagnosing Fiber Performance Issues


Diagnosing Fiber Performance Issues |
|
|
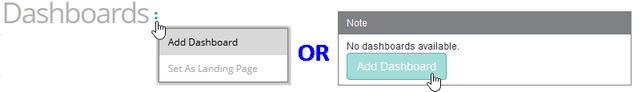
Each external data port is represented by a Fiber Port instance. The attributes of this monitor type provide an in-depth picture of the traffic on each fiber link. This will notably help administrators identify which port or which type of traffic (open systems, mainframes, etc.) constitutes a bottleneck or diagnose 'multi-pathing' issues. There are several groups of attributes for each instance of the IBM DS Fiber Port monitor type that represent the different types of traffic on the port: •ECDK-prefixed attributes for mainframe traffic •PPRC-prefixed attributes for unit to unit replication traffic •SCSI-prefixed attributes for open system traffic (standard SCSI over fiber channel traffic) To report on the traffic of each port, it is recommended to start looking at the Received Byte Rate and Sent Byte Rate. If these attributes show a bottleneck, the other attributes will help identify the type of traffic that is causing this performance issue. To diagnose fiber ports performance issues, you will need to create a simple one-row dashboard. Dashboards allow you to gather specific types of data and display them in a consolidated graphical format. For detailed information about dashboards options and features, refer to the BMC documentation. 1.Login to your BMC TrueSight Operations Management console. 2.Select Dashboards from the navigation pane. 3.In the Dashboards page, click Add Dashboard or select Add Dashboard from the dashboard action menu
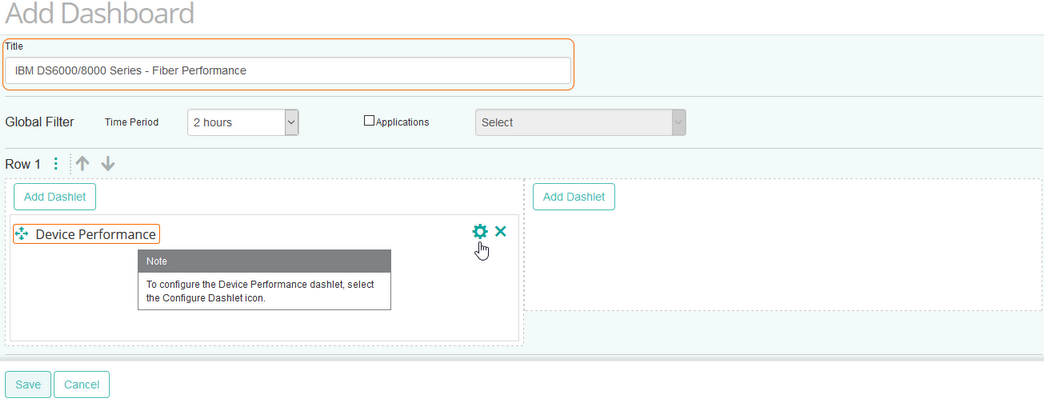
4.Enter a Title for your dashboard and configure a Global Filter, if needed. 5.Click Add Dashlet to open the dashlet library for the first column of the row. 6.From the dashlet library, select the Device Performance template, and then click Close.
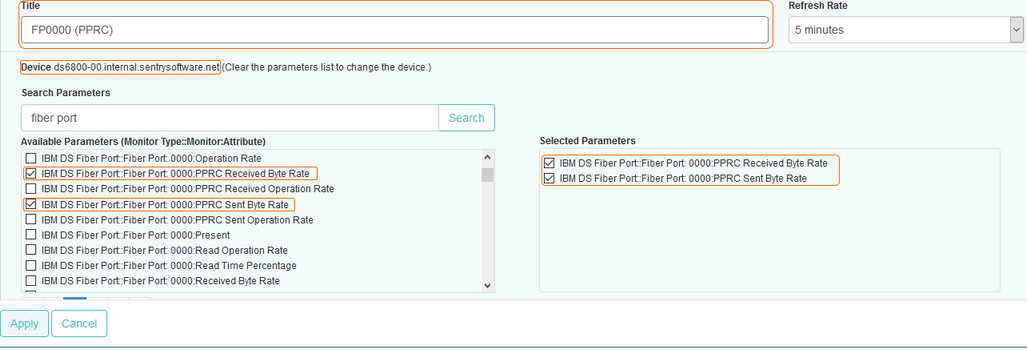
7.Select Configure Dashlet by clicking the 8.In the panel of input fields and options that opens below the dashboard, enter a Title for the dashlet and specify a Refresh Rate (default is 5 minutes). 9.Select the IBM storage device for which you want to compare fiber performance. 10.Select the Received Byte Rate and the Sent Byte Rate parameters for the first port, and click Apply.
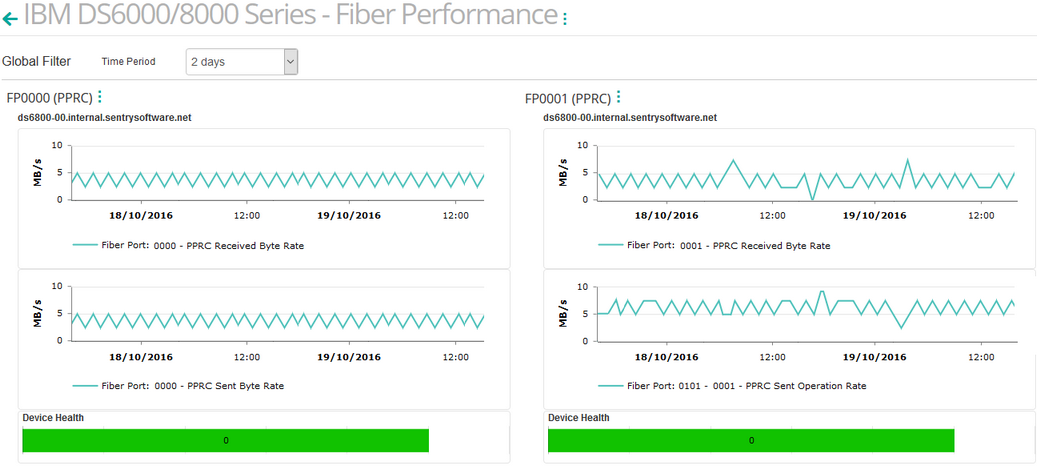
11.Repeat this operation in the next column of the dashboard for another port and click Save. 12.The dashboard is completed and shows the Received and Sent Byte Rate for both ports.
9.If you notice a performance problem when analyzing the received/sent byte transfer on the mainframe traffic, you can then create a new view with the ECDK/SCSI-prefixed attributes to identify the source of the problem. Repeat the procedure and create a view for the following attributes: ▪ECKD Received/Sent Byte Rate ▪SCSI Received/Sent Byte Rate Analyzing the generated graphs will help you identify the origin of the bottleneck. Related Topics Monitoring your Storage Environment |