Diagnosing Slow Volumes


Diagnosing Slow Volumes |
|
|
When servers are experiencing slow I/Os performance, you may want to verify the actual response time of the volumes the server is relying on. The response time represent the average time it takes to complete the read/write operations on a volume during the collection process. Typically, the average response time is below 10 milliseconds. You may also want to compare this value with other volumes' response time to find out if they have relatively similar throughput or if one server is really getting worse I/O performance than another. The industry common guidelines in terms of response time are:
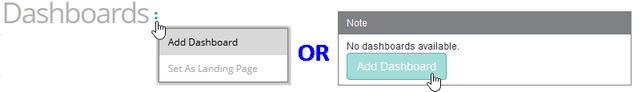
To identify slow volumes, you will need to create a simple one-row dashboard. Dashboards allow you to gather specific types of data and display them in a consolidated graphical format. For detailed information about dashboards options and features, refer to the BMC documentation. To Diagnose a Slow Volume1.Login to your BMC TrueSight Operations Management console. 2.Select Dashboards from the navigation pane. 3.In the Dashboards page, click Add Dashboard or select Add Dashboard from the dashboard action menu
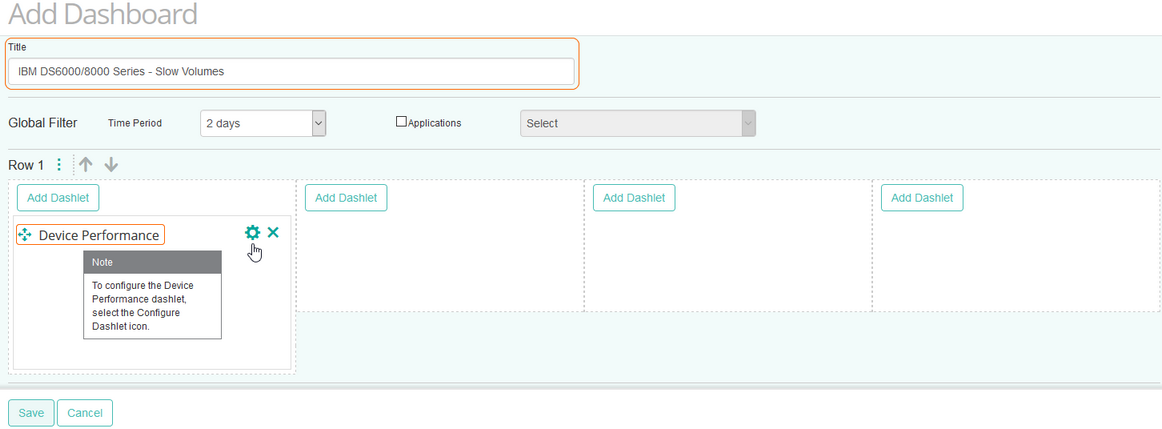
4.Enter a Title for your dashboard and configure a Global Filter, if needed. 5.Click Add Dashlet to open the dashlet library for the first column of the row. 6.From the dashlet library, select the Device Performance template, and then click Close.
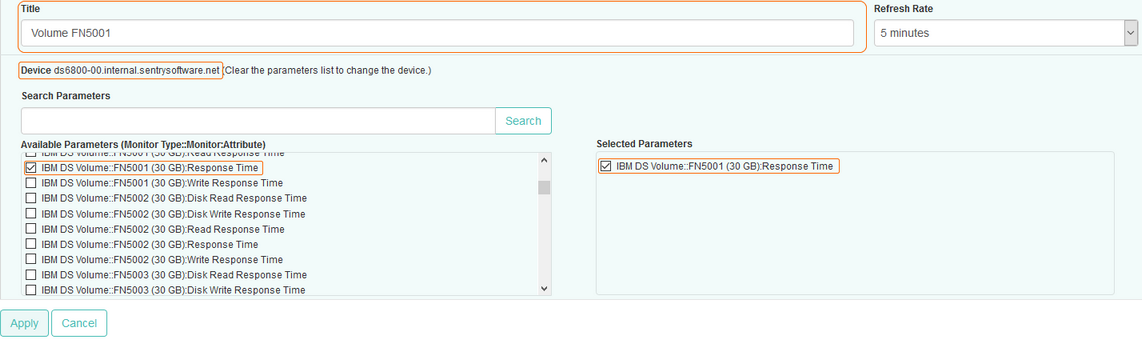
7.Select Configure Dashlet by clicking the 8.In the panel of input fields and options that opens below the dashboard, enter a Title for the dashlet and specify a Refresh Rate (default is 5 minutes). 9.Select the IBM storage device for which you to compare volumes I/Os. 10.Select the Response Time for the first volume, and click Apply.
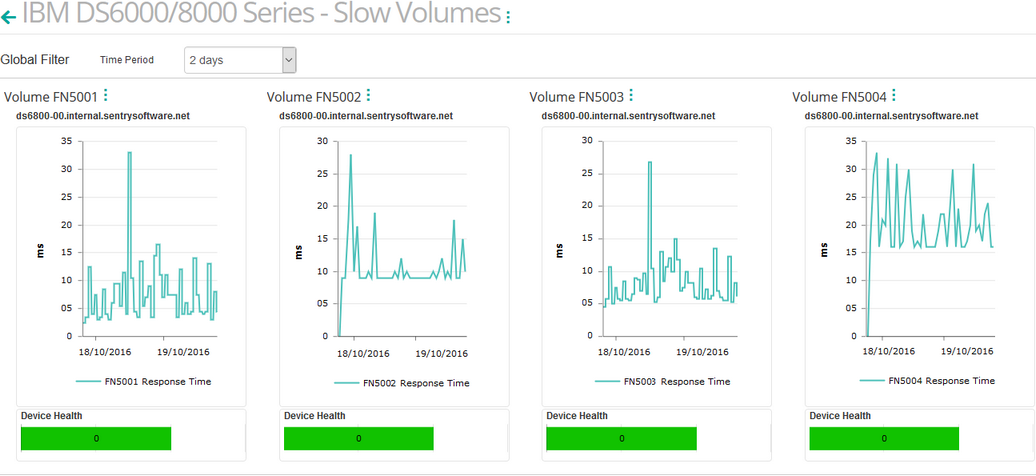
11.Repeat this operation in the next column of the dashboard for other volumes and click Save. 12.The dashboard is completed and shows the Response Time for all the selected volumes.
If the response time is high, you will need to check the amount of data that is written and read on this volume. The bad performance may simply be due to an abnormally large amount of data to process. Related Topics Monitoring your Storage Environment Creating Consolidated Data Views with Dashboards
|