Monitoring Devices: Processors, Memory Modules and Network interfaces


|
Monitoring Devices: Processors, Memory Modules and Network interfaces |
|
|
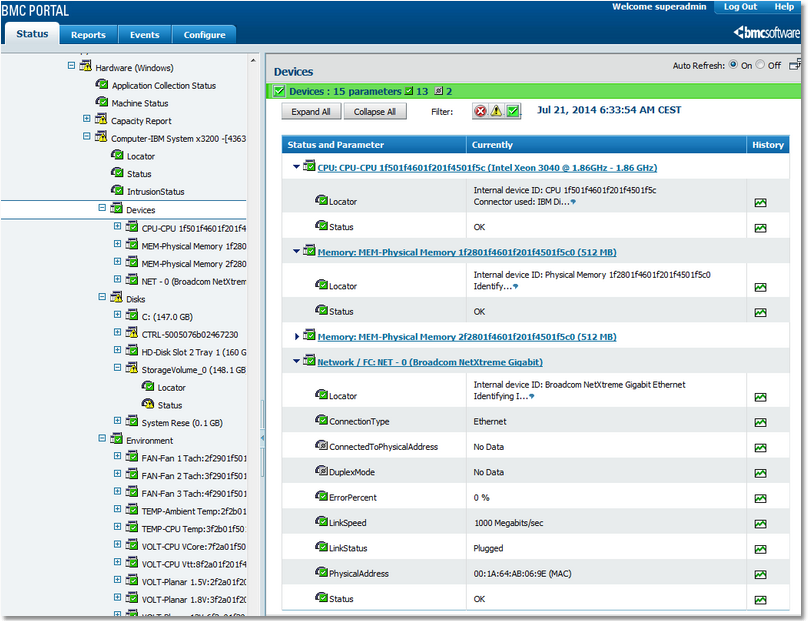
BPM Express for Hardware automatically detects the information sources available on the monitored computer and displays the hardware information provided by those sources in the Portal interface. It is the Devices icon that regroups the icons created for each sensor found for the processors, memory modules, network interfaces. If the components are detected, the icons are created automatically. In the left pane, click on an Element > Hardware (<platform>) > Computer Type > Devices and see the discovered components in detail in the right panel. An icon is created for each detected device. Each icon is labeled with a description of the device: ID, size, vendor, role, etc. Clicking the icon in the left pane, displays its details in the right pane. If a device appears to be missing, the Status parameter will trigger an alert if necessary.
Monitoring devices: CPUs, memory modules, network interfaces and other devices Status is a text parameter that describes the overall status of the corresponding device or sensor. It is the Status parameter that raises alerts when any of the other parameters for the device breach their thresholds. Alert conditions for Status describe in symbolic terms what occurs in the parameter when thresholds are breached: one exclamation mark triggers a warning; two exclamation marks raise an alarm.
Processors (also called CPU, Central Processing Unit) are obviously the most critical devices within a computer. While a processor fault may often lead to a system crash without a chance for a monitoring tool to catch the error, it can still be useful to monitor a server’s processors. In the case of a system crash due to a processor fault, the system reboots automatically. The reboot is either triggered by the operating system or by the motherboard itself. If a processor is no longer working, it is automatically disabled by the BIOS and, if there is one processor left, the operating system starts with one processor less. BPM Express for Hardware monitors each processor and checks that it is present and running. If a processor is missing upon reboot, BPM Express for Hardware will trigger an alert. On some recent or high-end servers, processors are able to correct some operation errors by themselves (like the ECC memory). If this information is available, it is displayed in the Portal by BPM Express for Hardware. In addition, if the processor is able to predict a failure, this information will be monitored by BPM Express for Hardware and reported in the Portal interface. Depending on the information available, the following parameters will be displayed for each discovered processor (CPU): ●The Status parameter represents the overall status of the processor. An alert is triggered if the processor is not available for proper operation (missing, disable by the BIOS due to a POST error, etc.) or if any if the other parameters breach their thresholds. ●The Predicted Failure parameter reports the predictive failure analysis, performed by the processor itself. This information is based on the rate of corrected errors. ●The Corrected Error Count parameter represents the number of errors that have been automatically corrected by the processor. This information can be very useful to predict a failure in the near future. ●The Current Speed parameter displays the current clock speed of the processor in megahertz. ●The Locator parameter helps to physically locate a component. The main memory of a computer is actually as critical as the processors since almost all processor operations deal with the memory. A single memory fault will lead to severe computer crash with, potentially, data corruption. On servers, the memory modules (the devices where the memory data is actually stored) often include auto-correction features (ECC), and sometimes even better: RAID5-like memory configuration. These features and configurations allow the memory modules to report statistics on failures, to predict failures, to hot-replace a memory module upon failure, etc. Depending on the available information and the features provided by the motherboard and the memory modules, the Error Count and/or Predicted Failure and/or Status parameters will be displayed for each discovered memory module: ●The Error Count parameter reports the number of errors that have been detected by the memory module and then corrected. A steadily growing value means that the memory module is not reliable and that it could encounter errors that it is unable to correct and that will then crash the system. ●The Predicted Failure parameter is reported by the memory modules which try to predict if it is going to fail by analyzing the trend of the number of detected/corrected errors (thanks to the ECC technology). If this parameter goes into alarm, you should remove the faulty memory module and replace it with a new one. ●The Status parameter represents the overall status of the memory module. An alert is triggered if the memory module reports a failure (in a RAID5-like configuration), if it is missing after a computer reboot or if any of the other parameters breach their thresholds. Network interfaces are devices that serve as a common interface for various other devices within a local area network (LAN), or as an interface to allow networked computers to connect to an outside network. It is therefore essential to make sure these devices are properly running and linked to the network. For each network interface discovered, the Status, Error Percent and/or Link Status parameters are displayed: ●The Status parameter represents the overall status of the network interface. An alert is triggered when the network interface is not responding, or any of the other parameters’ thresholds are breached. ●The Link Status parameter reports whether or not the adapter is properly linked to the network from a pure hardware cable perspective (it will not report a bad IP configuration for example). By default, the Link Status parameter raises an alert (through Status) only for previously connected network adapters that are no longer linked to the network. ●The Error Percent parameter represents the percentage of sent and received network packets that were in error. A high percentage of errors often means that the network link is improperly configured or that the network card is functioning poorly and thus needs to be replaced. Related Topics |