-
Home
- Integrations
Integration with BMC Helix Operations Management
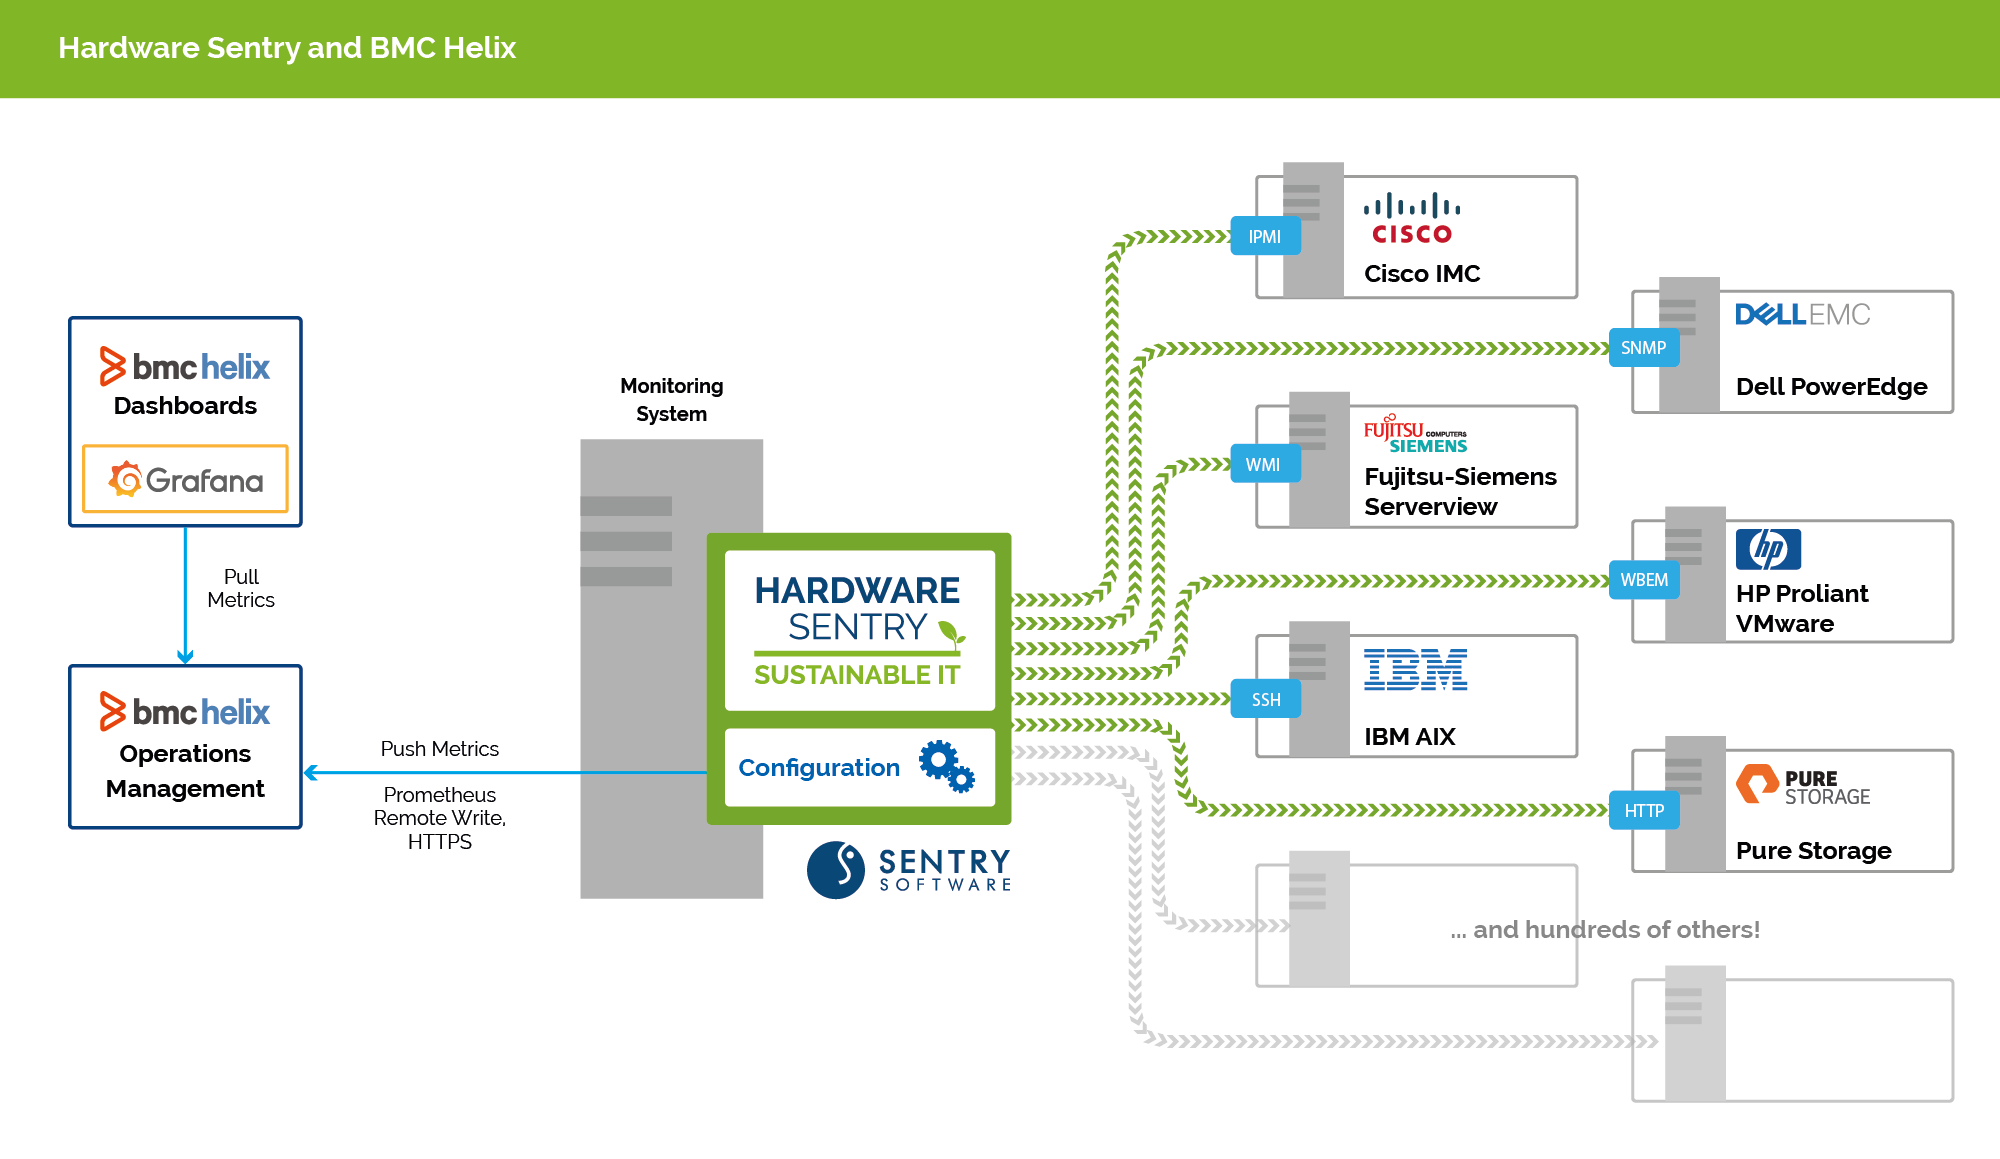
Hardware Sentry easily integrates with BMC Helix Operations Management to expose hardware health, performance metrics, and sustainability indicators into Helix Dashboards. The integration is achieved by using the standard Prometheus Remote Write protocol, which can be ingested by the BMC Helix platform.

Prerequisites
Configuration
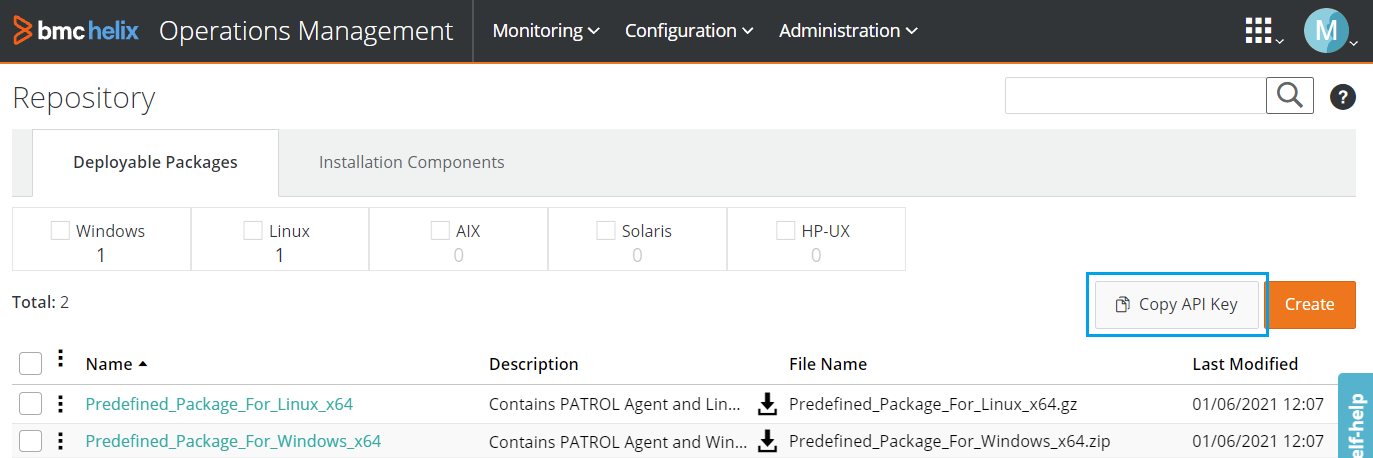
First connect to BMC Helix Operations Management, go to the Administration > Repository page, and click on the Copy API Key button to get your API Key.

Then, declare the exporter in the pipeline section of otel/otel-config.yaml:
service:
  extensions: [health_check]
  pipelines:
    metrics:
      receivers: [prometheus_exec/hws-exporter,prometheus/internal]
      processors: [memory_limiter,batch,metricstransform]
      exporters: [prometheusremotewrite/helix] # Your helix config must be listed here
Edit the exporters section of the otel/otel-config.yaml configuration file as in the below example:
  prometheusremotewrite/helix:
    endpoint: https://<your-helix-env>.onbmc.com/metrics-gateway-service/api/v1.0/prometheus
    headers:
      Authorization: Bearer <apiToken>
    resource_to_telemetry_conversion:
      enabled: true
where:
<your-helix-env>is the host name of your BMC Helix environment, at onbmc.com<apiToken>is the API Key of your BMC Helix environmentresource_to_telemetry_conversionconverts all the resource attributes to metric labels when enabled
Using Hardware Sentry dashboards in BMC Helix
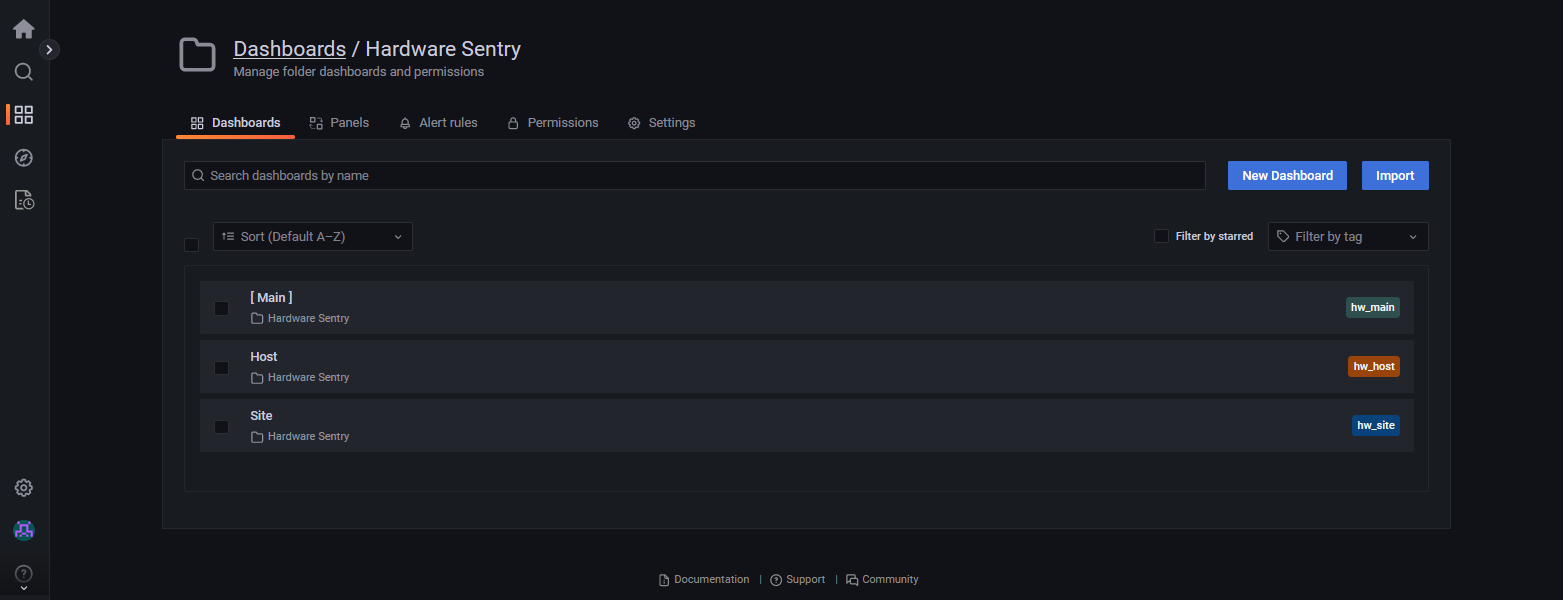
Hardware Sentry comes with a set of 3 dashboards that expose health, performance and sustainability metrics and indicators:
- Main: Global hardware and sustainability information for your entire monitored infrastructure
- Site: Deep insight into a specific site (server room)
- Host: Detailed metrics for a host and its internal components
Dashboards are organized into panels exposing systems' health and performance metrics, real-time and projected data on energy consumption and costs, as well as carbon emissions for your monitored infrastructure.
From the BMC Helix Dashboards Home Page, browse the Dashboards menu and select the Hardware Sentry folder to access the Hardware Sentry dashboards.

Understanding the monitoring coverage of your IT infrastructure
The ability to monitor your entire IT infrastructure is essential if you want to prevent or fix performance issues before they affect your customers and business. Reaching 100% coverage is a legitimate goal. The Coverage panels of the Hardware Sentry - Main and Hardware Sentry - Site dashboards expose the percentage of hosts that are actually monitored.
A coverage percentage below 100% indicates that some hosts are not monitored adequately. In such a case, you can:
- Check the Hardware Sentry Agents Status panel at the bottom of the Main dashboard to make sure that the Hardware Sentry Agents responsible for collecting data are fully operational. The panel displays the agents' hostnames and indicates if the agent and connector versions are up-to-date. The Last Seen column indicates the last time an agent was seen over the past 6 hours.
An agent going undetected for more than 2 minutes may indicate a potential problem with the host, the connection, or the agent configuration.
- Open each Site dashboard to spot the hosts with no collected data. Then, from the host page, verify the configured Protocol(s) status and matching Connector(s). If their status is Down or Failed, open the config/hws-config.yaml file and verify the host configuration. If you have manually defined the connectors, check the
selectedConnectorsandexcludedConnectorsparameters (See Configuring the Hardware Sentry Agent).
Note: A low coverage value will automatically increase the Margin of Error, minimizing the accuracy of the estimated trends reported in the Power, Costs, and CO₂ Emissions panel.
Monitoring energy usage and carbon emissions
In addition to detailed operational data, Hardware Sentry dashboards expose unified, accurate, and continuous views of power consumption, energy costs, and carbon emissions. These indicators allow IT administrators to assess the current situation, identify excessive energy usage or other issues, and take action to gain in efficiency.
The Power, Cost, and CO₂ emissions section of the Hardware Sentry - Main and Hardware Sentry - Site dashboards display live, and historical metrics about the amount of kWh your infrastructure consumes daily, monthly, and yearly as well as the associated costs and carbon emission levels.

The Margin of Error panel indicates the level of confidence in the estimated values. The lower the Margin of Error, the more accurate the estimate.
Hardware Sentry also reports the power consumption, energy costs, and the CO₂ emissions of each monitored host in the corresponding Hardware Sentry - Host dashboard.

The Power per Device Type panel shows the distribution of the energy consumed by the internal components, by type, for the monitored host.
Identifying the top consumer sites
Operating servers that no longer meet high efficiency standards can result in high electricity consumption, costs, and carbon emission levels. Hardware Sentry can help you identify the most energy-intensive sites and hosts to reduce your electricity bills and carbon emissions.
The Total Power column of the Sites section in the Hardware Sentry - Main dashboard displays the total power consumption of the monitored hosts by site. The sites with the higher Total Power are the most energy-consuming.

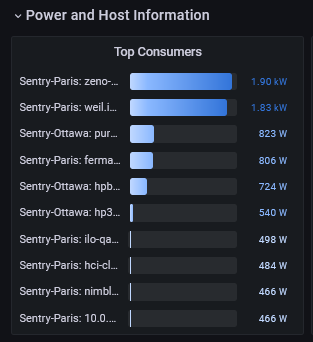
Scroll down to the Top Consumers panel available in the Power and Host Information section. The Top Consumers panel lists the top ten most energy-intensive hosts in your entire infrastructure.

Note: Metrics are automatically updated according to the collection interval (By default: 2m).
Replacing older equipment with more efficient ones or moving servers to a site with a lower electricity cost can help you improve your sustainability goals and reduce your energy costs.
Click the histogram bar of a host to view detailed information about a specific system.
Optimizing a site's temperature
Data centers are energy-intensive facilities. This energy is converted into heat that must be dissipated away from the equipment racks to maintain an optimal room temperature. Therefore, the hardware devices' temperature is a critical parameter that must be closely monitored.
The Heating Margin panel exposes the number of degrees Celsius (°C) remaining before the temperature reaches the closest warning temperature threshold of a monitored host for each site.
Note: Some hardware devices do not expose their overall temperature and are, therefore, not included in the heating margin computation. Hardware Sentry provides the percentage of the Monitoring Confidence per site in the Site dashboard.

Combining the temperature indicators collected from each monitored server and component, Hardware Sentry calculates the Recommended Site Temperature that determines the temperature at which the site can safely operate. Increasing a server room temperature can generate substantial savings on your electricity bill (Potential Yearly Savings) and significantly reduce your facility's carbon emissions ( Potential Yearly CO₂ Reduction).