-
Home
- Integrations
New Relic Integration
Hardware Sentry seamlessly integrates with New Relic, allowing the exposure of hardware health, performance metrics, and sustainability indicators directly within New Relic Dashboards.

Prerequisites
Before you can start viewing the metrics collected by Hardware Sentry in New Relic, you must:
- Download and install Hardware Sentry on one or more systems that has network access to the physical servers, switches and storage systems to be monitored.
- Configure the monitoring of host(s).
- Install the Hardware Sentry dashboards from the New Relic Quickstarts page.
- Create an API key in New Relic as explained in the New Relic User Documentation.
Configuring the integration
Pushing Hardware Sentry metrics to New Relic
To send metrics to New Relic, Hardware Sentry will leverage New Relic's otlp receiver. Therefore, you only need to configure a new otlp exporter in the otel-config.yaml file as follows:
-
Browse to open the Hardware Sentry configuration directory for the OpenTelemetry Collector (
hws/otelby default) and open theotel-config.yamlconfiguration file. -
Find the
exporterssection and edit it as follows:otlp/newrelic: endpoint: <new-relic-endpoint-url> headers: api-key: <license_key>where:
-
<new-relic-endpoint-url>corresponds to the URL pointing to the New Relic OTLP receiver. Its value is:-
https://otlp.eu01.nr-data.net:4318for EU OTLP -
https://otlp.nr-data.net:4318for US OTLPRefer to the New Relic User Documentation for more details.
-
-
<license_key>corresponds to your Account License Key available on the API Keys page.
-
-
Declare this
otlp/newrelicexporter in thepipelinessection, undermetrics:, as follows:#... service: #... pipelines: metrics: receivers: [otlp, prometheus/internal] processors: [memory_limiter, batch, metricstransform] exporters: [otlp/newrelic] # <-- Add otlp/newrelicAdditionally, if you want to receive hardware alerts as logs in New Relic, declare this
otlp/newrelicexporter in thepipelinessection, underlogs:, as follows:#... service: #... pipelines: # [...] logs: receivers: [otlp] processors: [memory_limiter, batch] exporters: [otlp/newrelic] # <-- Add otlp/newrelic -
Restart Hardware Sentry to apply your changes.
Refer to Configuring the OpenTelemetry Collector for more details.
Checking that hardware metrics are sent to New Relic
To check that metrics are correctly sent to New Relic:
-
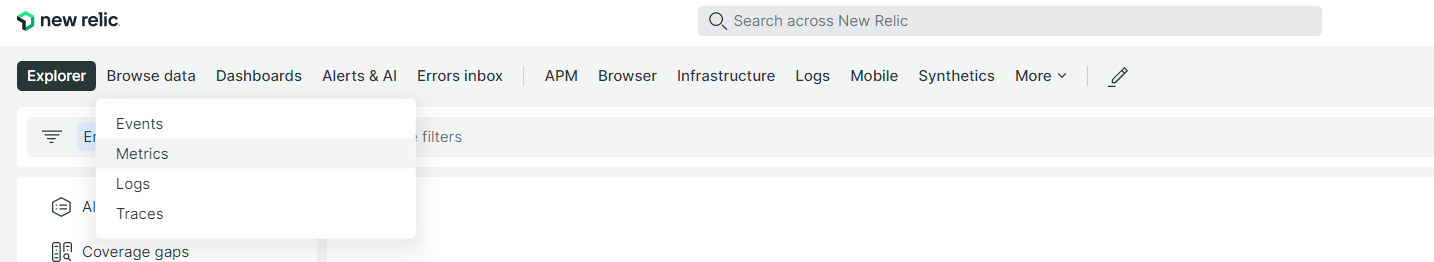
Select Browse Data, then Metrics
-
In the Browser Explorer, search for metrics starting with
hw.orhardware_sentry.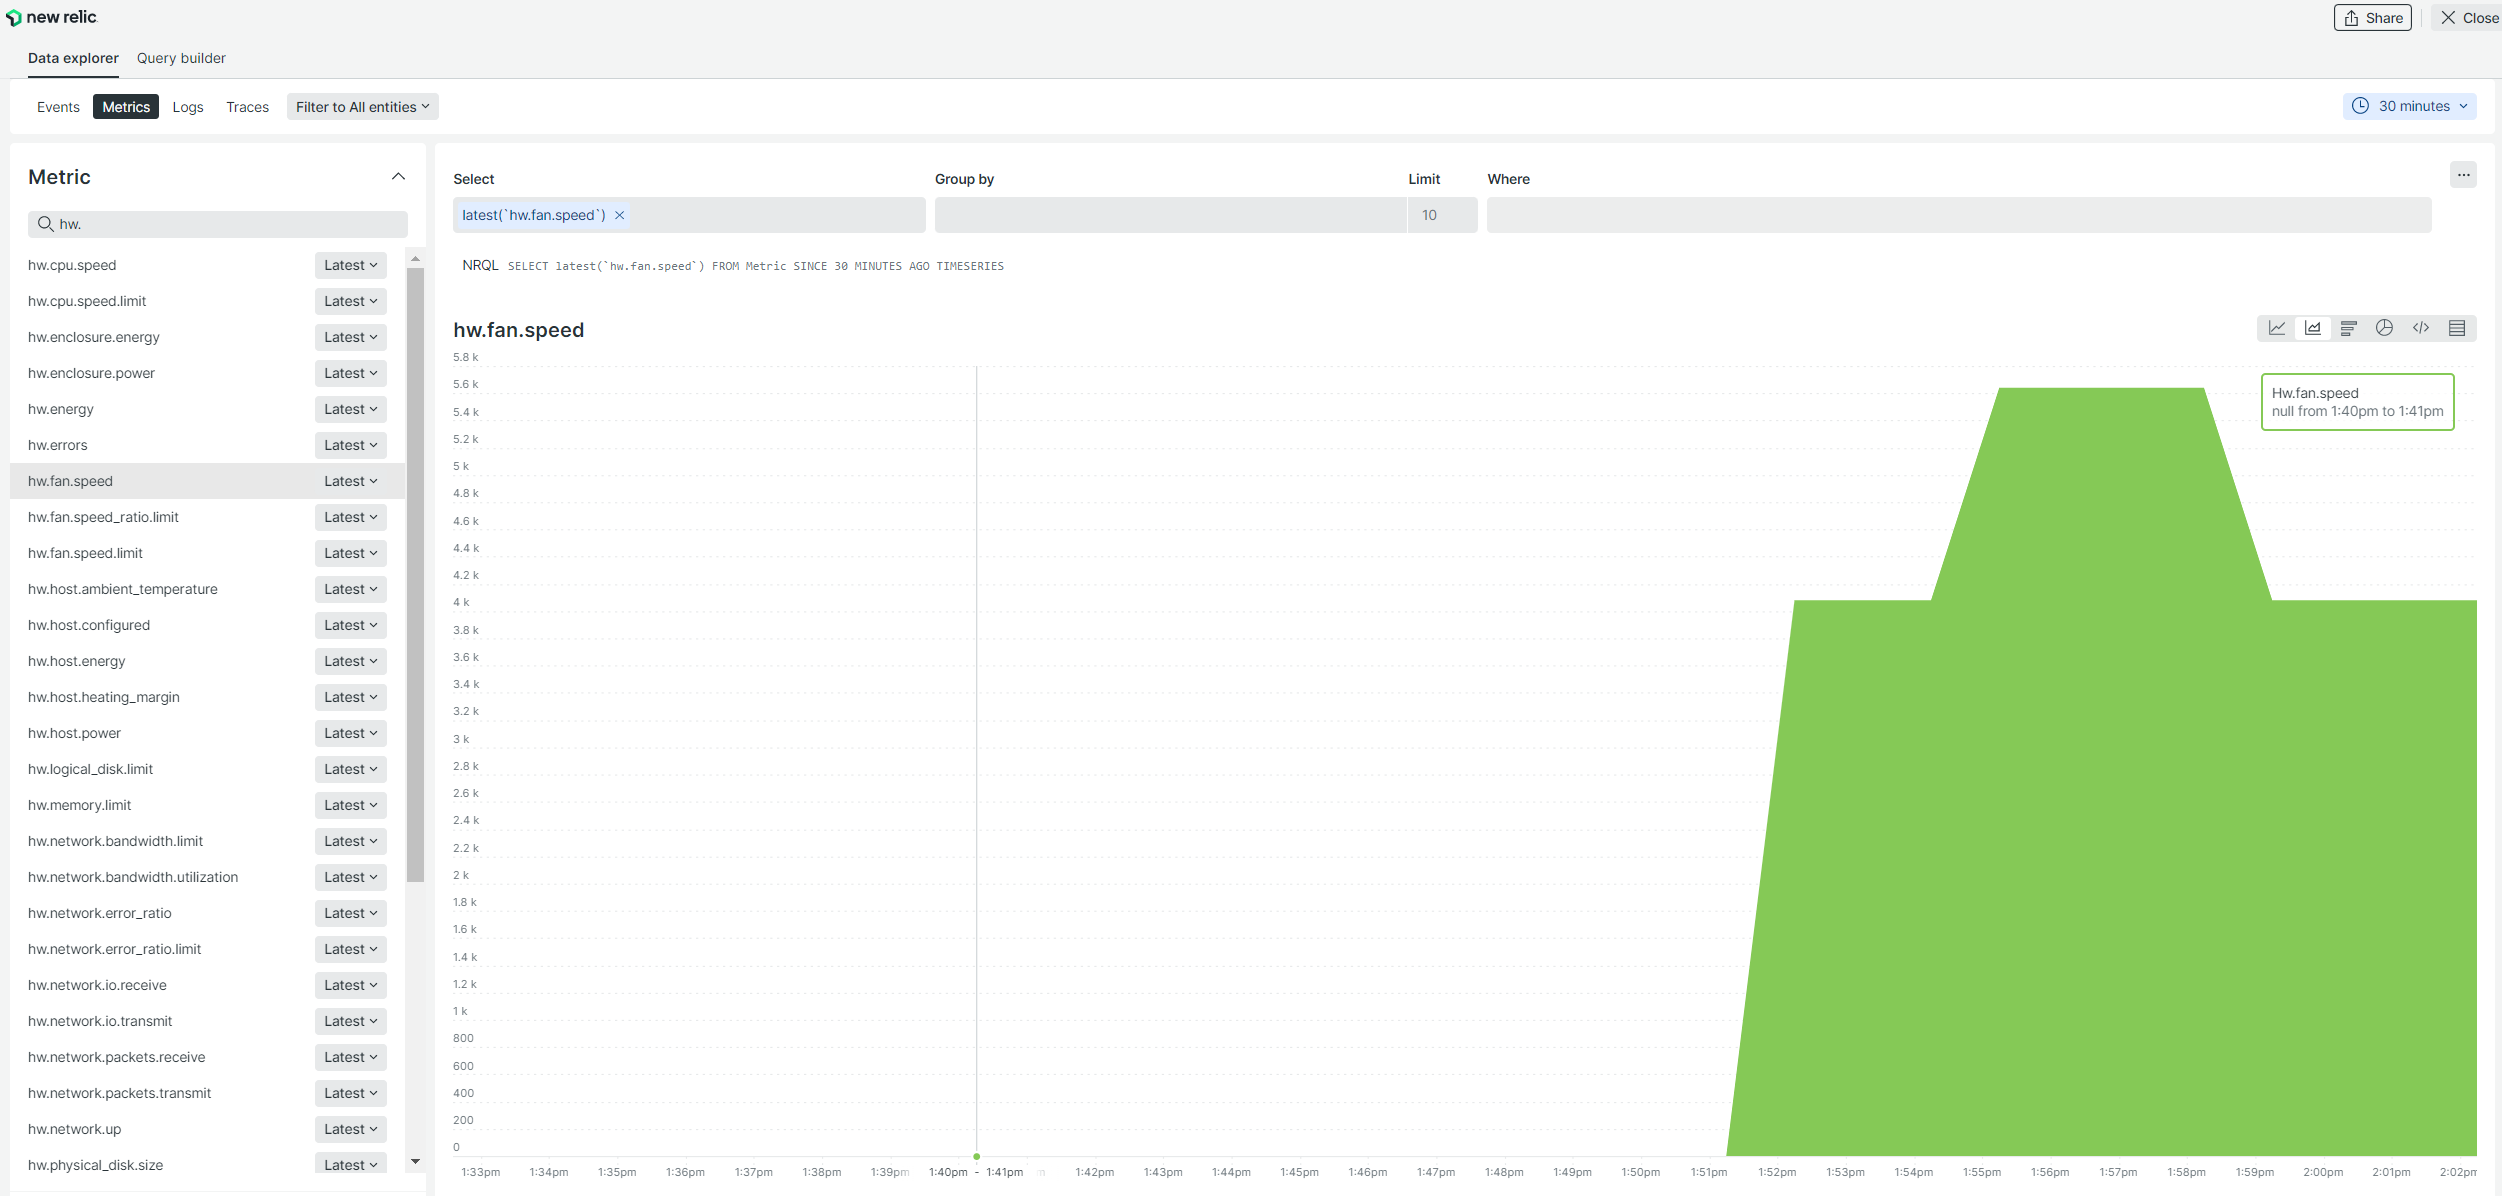
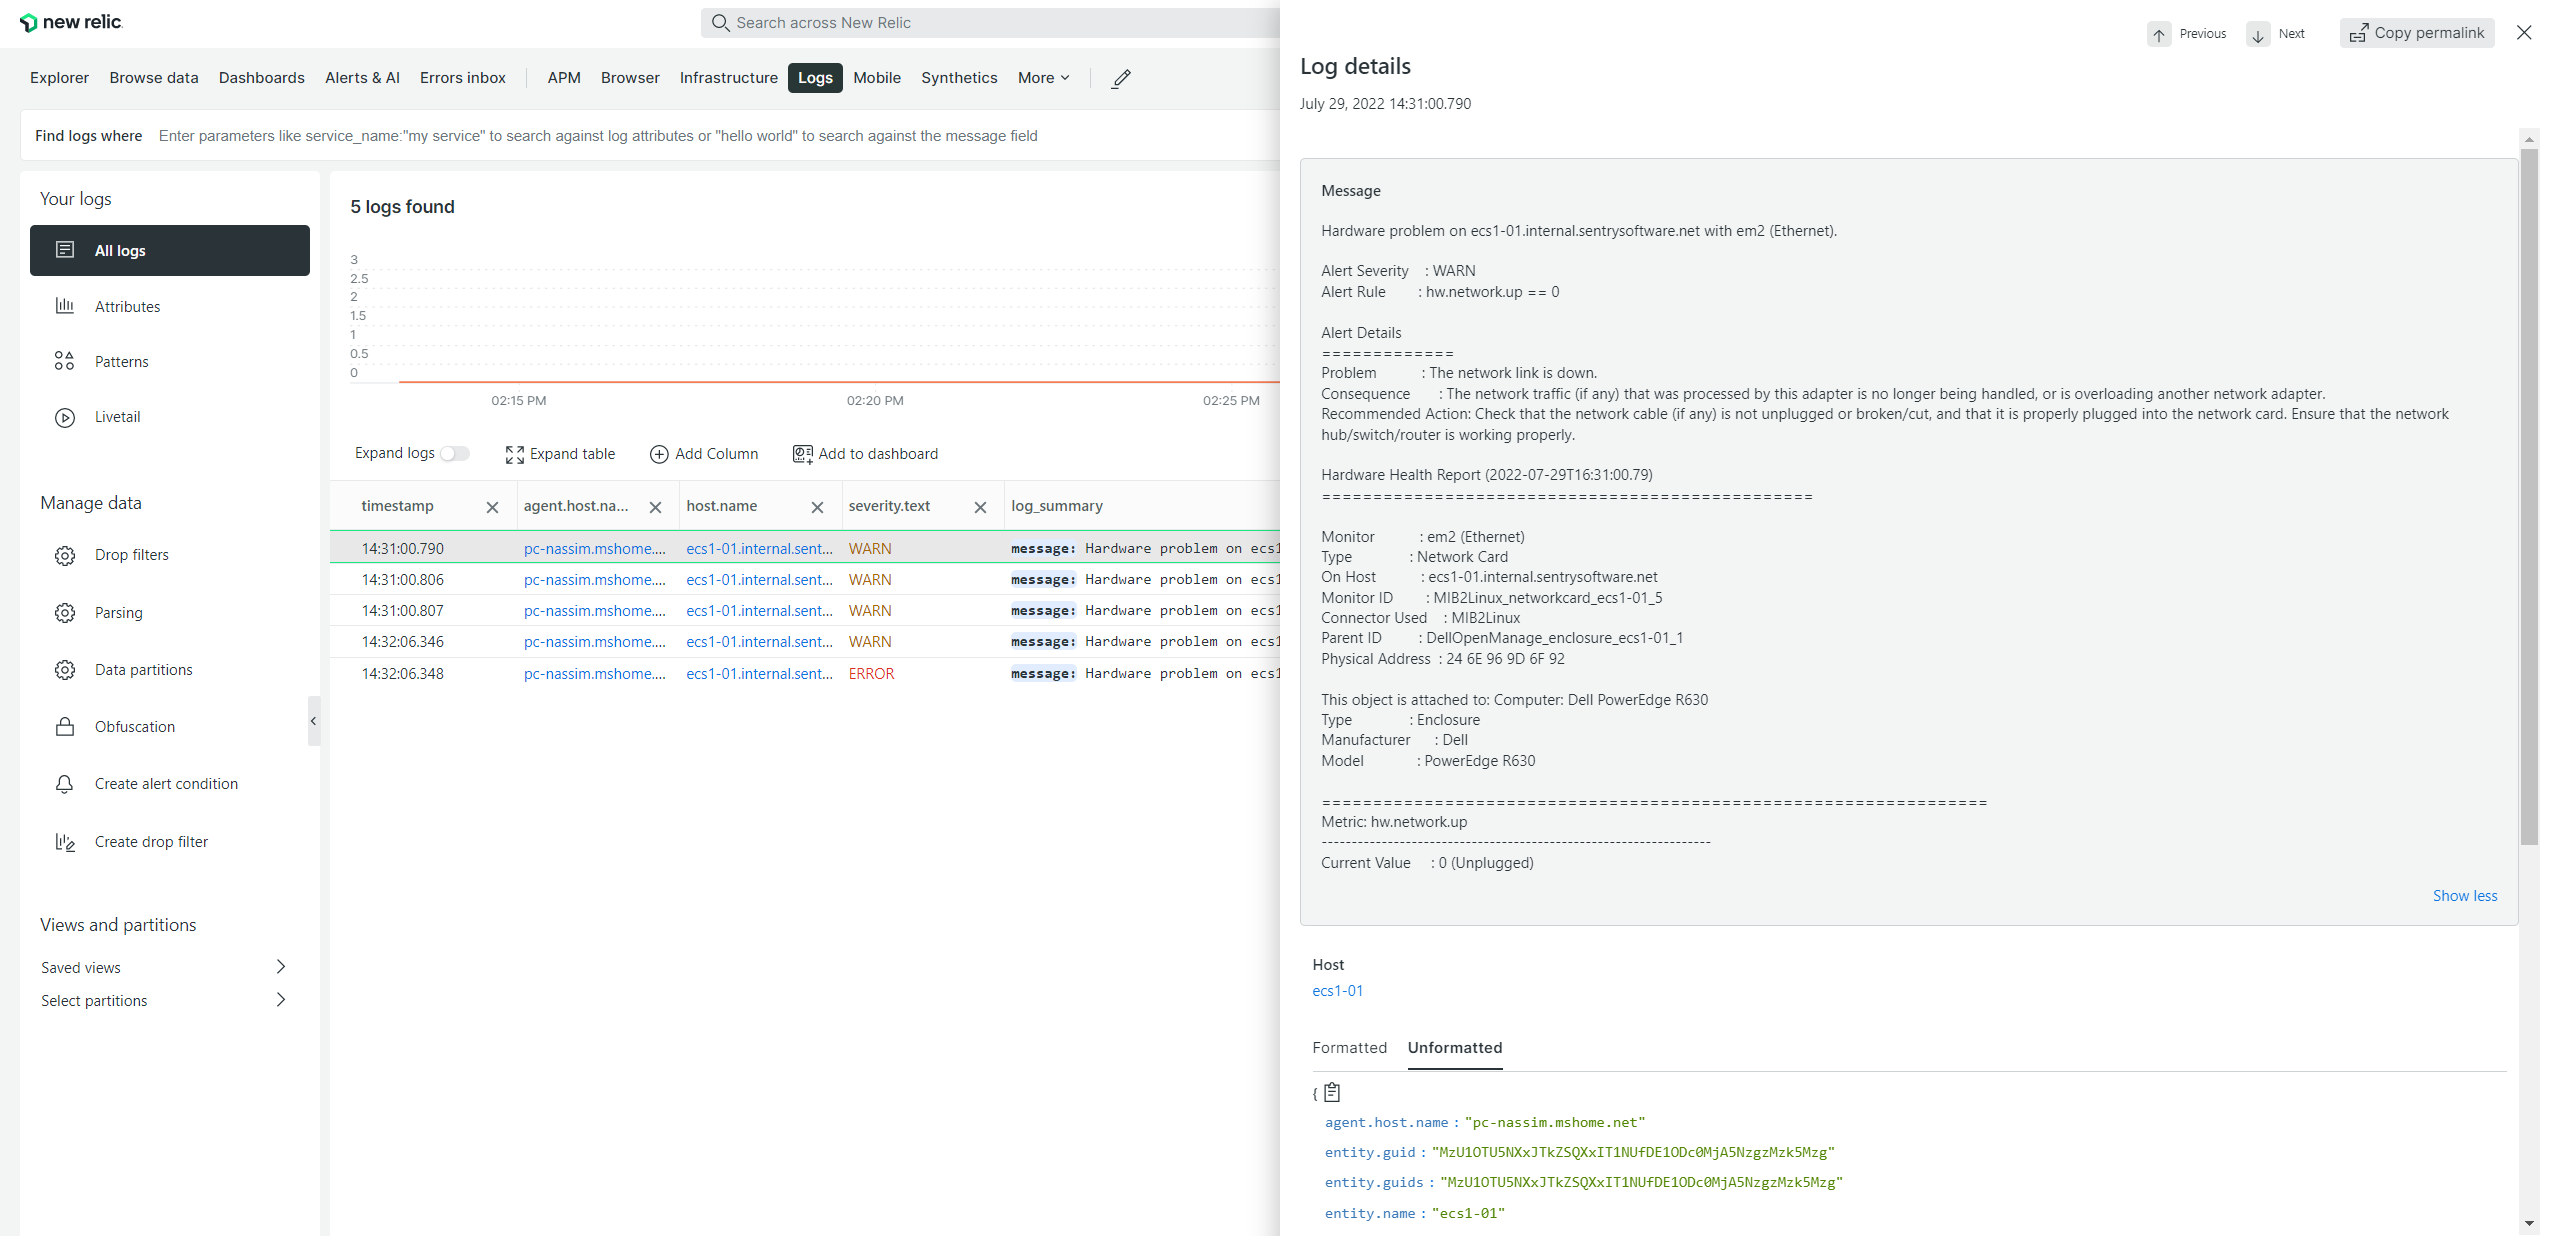
If you configure the OpenTelemetry Collector to also send logs, hardware problems will be reported as logs in New Relic: