|
The Windows Performance Monitoring tool incorporates Windows performance data, important to the proper functioning of your applications, within your PATROL environment. Alerts can be set to provide immediate notification in case one of the parameters you are monitoring is above or below a given range.
Performance monitor collects information about objects on your Windows computer and measures them. These objects can be processors, threads, processes, memory, etc., with each one having an associate set of counters and possibly instances. The data gathered by the Windows performances about specific components can be used to identify problems and bottlenecks within your application and plan ahead for your future needs.
A Windows performance is defined by a performance object name and a counter name, as well as anything from none to several instances. Furthermore, each performance counter contains a unique set of counters and instances. Some objects are built into the system, typically corresponding to the major hardware components, but others will only be accessible if the associated software has been installed.
Here are some definitions of the items as described by Microsoft:
| • | Performance object: A logical collection of counters that is associated with a resource or service that can be monitored. The objects that are typically installed on a system are: cache, memory, objects, paging file, physical disk, process, processor, server, system and thread. |
| • | Counter: A value corresponding to a particular aspect of the performance defined for the performance object. |
| • | Instance: A term used to distinguish between multiple performance objects of the same type on a computer. |
If an object has several instances, it is possible to monitor them either individually or all at once. In the latter case, you can choose to monitor the minimum, maximum, average or total value of the instances.
Windows Performance counter monitoring objects are instances of the SW_NTPERFORMANCE class.
Creating a Windows Performance monitoring
| 1. | In the PATROL Console, right-click the Monitored Application icon and select KM Commands > New > Windows Performance monitoring... |
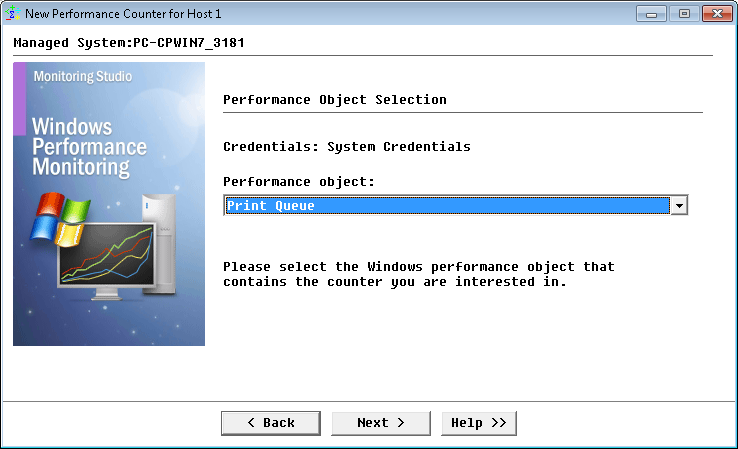
Windows Performance Monitoring Wizard — Welcome Page
| 2. | Select the Windows Performance Object that contains the counter and click Next. |
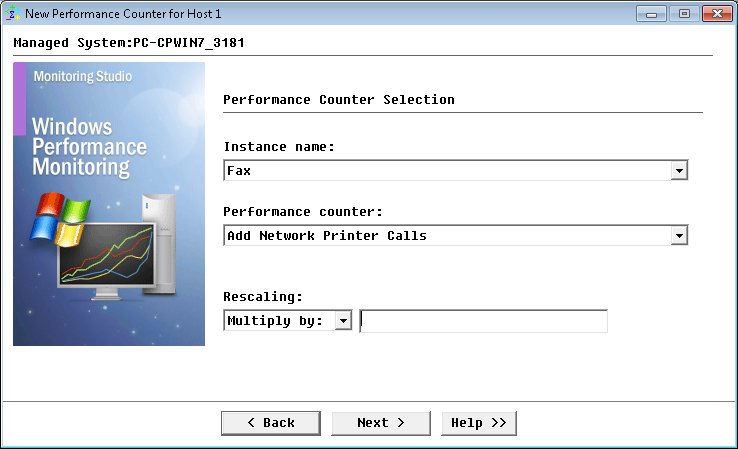
Windows Performance Monitoring Wizard — Definition Page
| This panel is displayed if one or more instances of the selected Windows Performance is found. Otherwise, a much simpler panel is shown displaying only the list of counters and the scale. |
| 3. | Select the counter and instances: |
| ▪ | Select one or more instances: This list displays the selected Windows Performance object instances. Select the one(s) you wish to monitor from the list. |
| ▪ | Select a counter: The counters available for the selected Windows Performance object are listed here. Select the one you wish to monitor |
| ▪ | Scale: A scale can be used to divide the Windows performance value by this number. To do so, enter the number you wish the value to be divided by (e.g.: the committed memory is expressed in bytes, so, to obtain the value in mega-bytes (MB), type "1024" in the field for scale. By default, the scale value is 1 (no scale). |
| 4. | If more than one instance is selected, create the PATROL object. The radio buttons at the bottom of the panel can be used to select the creation mode of the Windows performance PATROL object instance: |
| ▪ | Create one PATROL object per instance: All selected instances will have their own PATROL object and will be monitored separately. |
| ▪ | Group all selected instances into one PATROL object: All selected instances are grouped into one PATROL object and are monitored all together. If you select this option, you must choose one of the following: |
| ▪ | Calculate average of all selected instances for selected counter: Each value will be added then divided by the number of instances. So the average value of all the selected instances will be monitored. |
| ▪ | Use minimum value of all selected instances for selected counter: The minimum value of the different selected instances will be monitored. |
| ▪ | Use maximum value of all selected instances for selected counter: The maximum value of the different selected instances will be monitored. |
| ▪ | Calculate total value of all selected instances for selected counter: The value of each selected instance is added so the total value of all selected instances will be monitored. |
|


