- Performing Post-Installation Operations
- Configuring Advanced Settings
- Configuring Alerts
- Configuring the Discovery Overrides
- Configuring Logs
- Configuring Databases
- Filtering Elements to Monitor
- Configuring the Save Groups Monitoring
- Configuring the Save Groups Date/Time Format
- Configuring the Save Sets Monitoring
- Configuring the Group Backup Restriction Window
- Configuring the Pending Requests Monitoring
- Configuring the Pending Requests Date/Time Format
- Configuring the Multi-Node Monitoring Mode
- Configuring the Node Status
- Configuring the Node Type
-
Home
- PATROL
Configure EMC NetWorker KM
This section explains the settings required to configure EMC NetWorker KM via a PATROL console.
Performing Post-Installation Operations
It is recommended to perform post installation checks once the KM is installed and loaded on the PATROL Console to ensure it properly operates. Post-installation operations include:
- Configuring NetWorker Nodes Monitoring
- Configuring the KM user account
- Verifying:
- Restarting the PATROL Agent and PATROL Console.
Configuring NetWorker Nodes Monitoring
EMC NetWorker KM allows you to monitor several NetWorker servers and storage nodes with one PATROL agent. The configuration procedure is as follows:
-
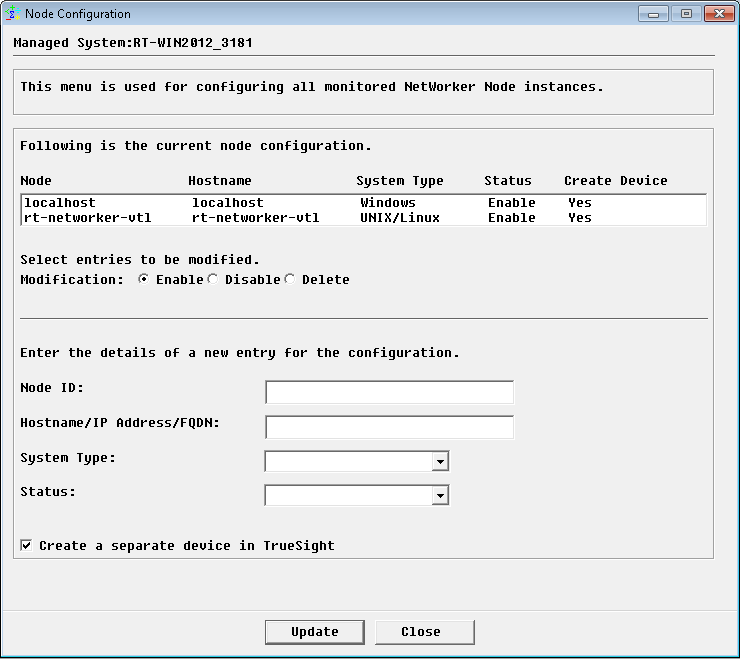
Right-click the EMC NetWorker main instance > Configuration > NetWorker Nodes…
-
Specify the NetWorker server details:
- Node ID: Enter an ID for the NetWorker node. This information is only required if a unique ID cannot be generated using the hostname provided.
- (Required) Hostname/IP Address/FQDN: Enter the hostname, IP address, or FQDN of the node to be monitored.
- (Required) System Type: Specify whether the NetWorker node is a UNIX/Linux or Windows system.
- (Required) Status: Select Enable to start the NetWorker node monitoring; Disable to stop it.
-
Check the Create a separate device in TrueSight box if you want the NetWorker nodes to appear as a separate device in TrueSight OM.
-
Click Update.

A NetWorker Setup node instance (NetWorker Setup: <node-id>) appears in the PATROL Console but the monitoring will not start until the appropriate credentials are entered using the Configuration > Login KM Command.
Configuring the KM User Account
A user account with administrative privileges must be configured in BMC PATROL or BMC TrueSight Operations Management to read and execute EMC NetWorker application programs and access file systems. Depending on the operating systems used, several options will be available. For more information, refer to Security Requirements.
To configure the KM user account:
-
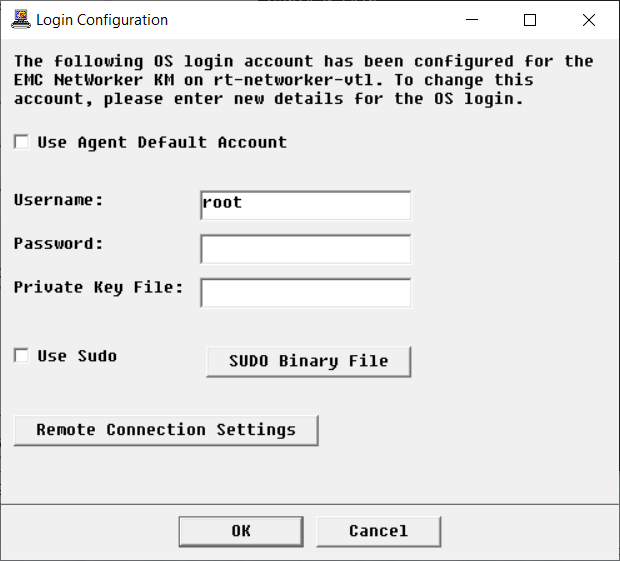
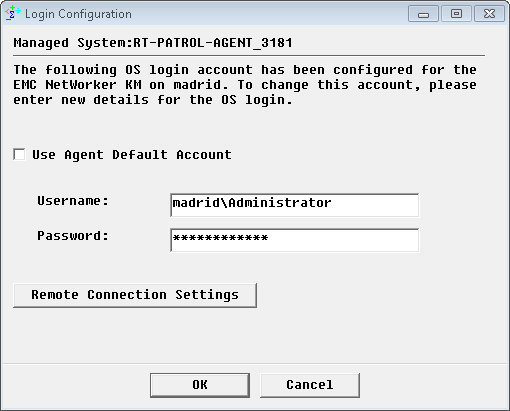
In the Console, right-click the host instance > KM Commands > Configuration > Login… The Login Configuration dialog box is displayed:
-
To use:
- the default PATROL Agent Account, check the Use Agent Default Account box and leave the Username, Password and Private Key File fields empty
- a different user account, enter the login details in the Username, Password and optional Private Key File fields. For SSH authentication, you can specify the path to a private key file on the PATROL Agent corresponding to the specified username and password.
-
If a sudo user account is used:
- check the Use Sudo box
- click SUDO Binary File to verify the sudo binary file path
-
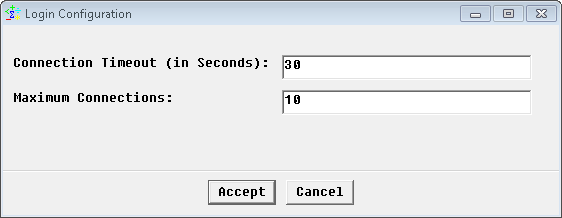
If you are monitoring a remote host, click Remote Connection Settings:
- Connection Timeout (in Seconds): Enter the number of seconds after which the connection to the remote node will timeout.
- Maximum Connections: Enter the maximum number of simultaneous connections allowed to the remote node.
- Click Accept.
-
Click OK.


If the credentials are not valid, the NSRLoginStatus parameter will appear in “suspicious state” after the next data collection.
Verifying the Application Discovery
To verify the application discovery:
-
Check that the NetWorker Setup instance changes to display the server type. If not, check the message in the NetWorker Setup instance and in the PATROL Console System Output Window (SOW) or in the log file <PATROL_HOME>/log/NSR_<port>.log. You can force a full discovery by right-clicking the NetWorker Setup instance > KM Commands > Force Discovery.
-
Check that the application class instances are actually instantiated. The initial data collection may take some time depending on the complexity of your environment (up to one hour). If needed, force a data collection by right-clicking the server instance > KM Commands > Refresh Parameters.
If the NetWorker server is configured in a clustered environment, you will have to enable multi-node mode monitoring.
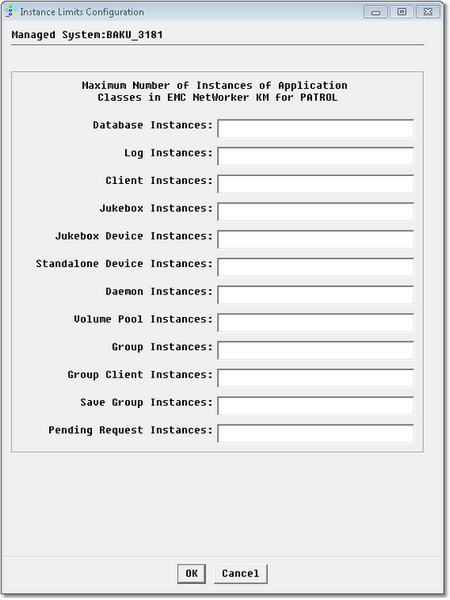
Configuring the Instance Limits
By default, EMC NetWorker KM monitors all the elements discovered, which may represent an important workload to the PATROL Agents and console. Because the monitoring of some elements may be irrelevant for various reasons, you can apply filters to indicate which elements will be monitored or not.
To modify the default configuration:
-
In the Console, right-click the server instance > KM Commands > Configuration > Instance Limits…
-
Enter the number of instances to be displayed in the console for each monitored element
-
To disable the monitoring of a specific application class, enter 0 (zero) in the relevant field
-
Click OK.

Verifying the Initial Setup
To check the initial setup of the KM:
-
Check for any error on the PATROL Console System Output Window (SOW) or in the
<PATROL_HOME>/log/NSR_<port>.log. -
Check whether the discovered files and directory paths are correct, using the menu Configuration > Paths… from the server instance.
-
Refer to the label of the server instance to check whether the discovered node type is correct. The node type can be modified, using the menu Configuration > Node Type… from the server instance.
-
Check the Infoboxes and Parameters of all the EMC NetWorker KM instances and verify that they are properly set.
-
Under each container instance, open all detail parameters (text parameters with names in the format
NSR<Object>Details), and check for error messages. -
Check the new value of the NSRLoginStatus and NSRNodeStatus parameters set after the completion of all data collection. If either is not in OK state, open the annotation point to determine the cause of the error. EMC NetWorker KM will check for the existence of the following daemons to determine the status of the node (parameter NSRNodeStatus). By default, these daemons are sought:
On a Server:
| Daemon | Description |
|---|---|
| nsrd | Master NetWorker Server Daemon |
| nsrexecd | NetWorker Client Execution Daemon |
| nsrindexd | NetWorker File Index Daemon |
| nsrmmd | NetWorker Media Multiplexor Daemon |
| nsrmmdbd | NetWorker Media (Volume) Management Database Daemon |
On a Storage Node:
| Daemon | Description |
|---|---|
| nsrexecd | NetWorker Client Execution Daemon |
| nsrmmd | NetWorker Media Multiplexor Daemon |
These default daemons can however be changed through the menu Configuration > Node Status…. Refer to Configuring the Node Status for more details.
-
After the KM has been running for at least an hour:
- Right-click the server instance > KM commands > KM Status… from the EMC NetWorker instance. A report is displayed, detailing information on the managed system. Check through the report for any warning or alarm. If any error is found during any of the above steps (including any incorrect data in Infoboxes or any warning or alarm in the KM Status report), determine the cause(s) and take steps to resolve these errors. You may need to refer to the User Guide, or contact Technical Support, attaching the KM Status report.
- If needed, click Save As Task to open the report in a task window. You could later save it as a text file or print it.
-
The KM installed on the storage node may monitor the same elements which are already monitored through the server node. This may be unnecessary and can trigger duplicate alerts. You can disable these components on either the server or the storage node by setting their instance limit to 0 (zero), using the menu Configuration > Instance Limits….
Restarting PATROL Agent and PATROL Console
Restarting the PATROL Agent and PATROL Console is optional but often a good practice to confirm that the EMC NetWorker KM operates correctly.
In addition, the PATROL Agent restart will force all KM discoveries and data collections to start immediately.
Configuring Advanced Settings
Configuring Alerts
Configuring Alerts Rules
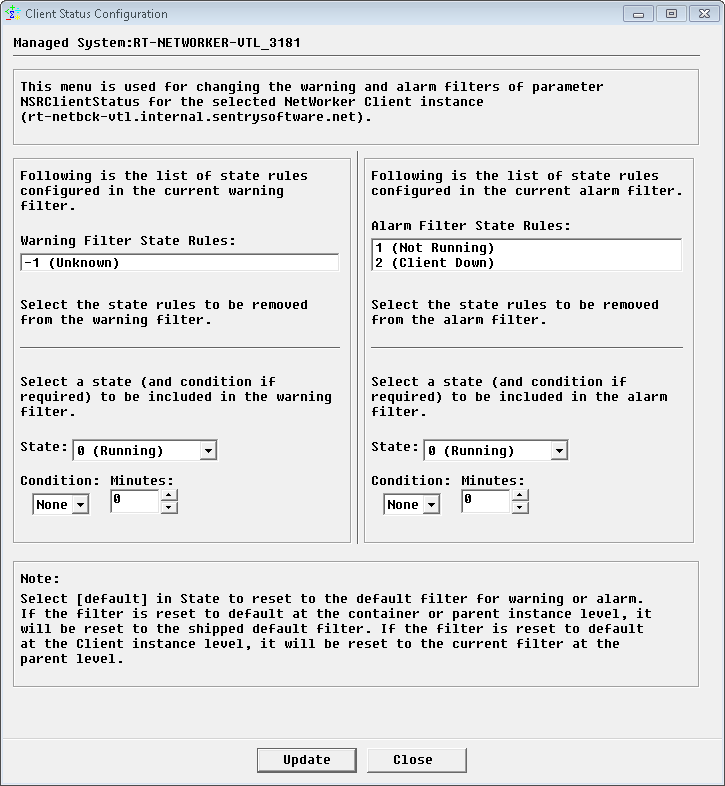
The status of an element is determined by the State parameter and by the status mapping rule. This mapping rule indicates which states will trigger a warning or an alarm on the Status parameter. It can be configured as follows:
-
In the Console, right-click one of the instance for which you want to configure the status and select > KM commands > Configuration > Instance Status…
-
In the Warning Filter State Rules list, select the states that will not trigger a warning
-
If needed, apply a time condition to a specific state. For example, if you want to trigger a warning when the Client is in Unknown state for more than 120 minutes:
- From the State list, select -1 (Unknown)
- From the Condition list, select >
- In the Minutes field, enter 120
-
In the Alarm Filter State Rules list, select the states that will not trigger an alarm
-
If needed, apply a time condition to a specific state. For example, if you want to trigger an alarm when the Client is in Client Down state for more than 240 minutes:
- From the State list, select 2 (Client Down)
- From the Condition list, select >
- In the Minutes field, enter 240
-
Click Update. The mapping rule will be applied to that specific instance.
To revert to the default status mapping rule for either filter, select [default] from the list of states and click Update.
-
Resume the procedure for all the instances for which you wish to apply monitoring filters.

Configuring Alert Acknowledgement
By default, alerts will automatically be acknowledged unless you modified the settings to allow manual acknowledgement.
Please note that manual acknowledgement may impact the performance of the application and of the PATROL Agent if the number of alerts waiting to be acknowledged constantly increases.
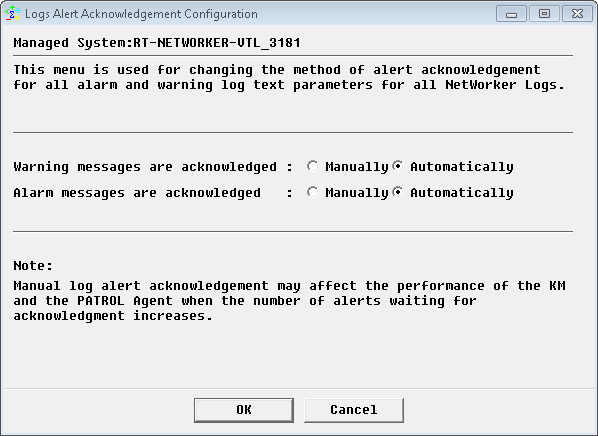
Configuring Logs Alert Acknowledgement
By default, log alerts are automatically acknowledged when new ones are detected. To change the default behavior:
-
In the Console, right-click the Log(s) instance > KM Commands > Configuration > Log(s) Alert Acknowledgement…
-
Indicate whether the warning and alarm messages will be manually or automatically acknowledged
-
Click OK.

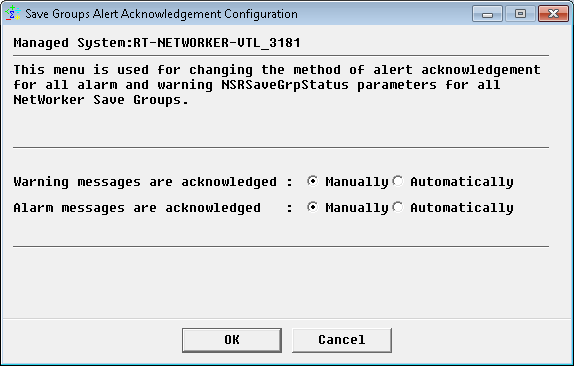
Configuring Save Groups Alert Acknowledgement
By default, save group alerts are automatically acknowledged when new ones are detected. To change the default behavior:
-
In the Console, right-click the Save Groups instance > KM Commands > Configuration > Save Groups Alert Acknowledgement…
-
Indicate whether the warning and alarm messages will be manually or automatically acknowledged
-
Click OK.

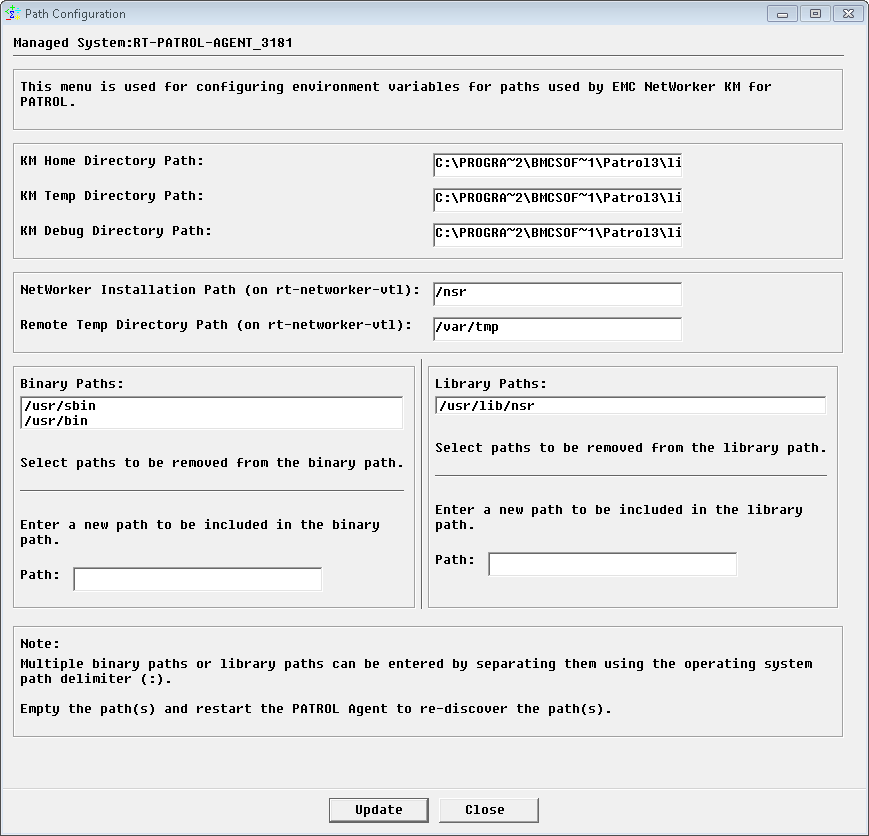
Configuring the Discovery Overrides
The solution automatically discovers the installation, binary, and library paths. This information can however be overridden.
To configure paths:
-
In the Console, right-click the server instance > KM commands > Configuration > Paths…
-
In the KM section, verify and possibly modify the Home, Temp, and Debug Directory Paths
-
In the NetWorker section, verify and possibly modify the Installation and the Remote Temp Directory (remote nodes only) Paths
-
In the Binary Paths and Library Paths sections:
- From the list, select the paths to be removed
- In the Path field, enter the new path(s) to be included. If several paths are to be entered, separate them with a colon (:).
-
Click OK.

If you want to rediscover the paths, empty all fields, click OK, and restart the PATROL Agent.
Configuring Logs
By default, the following log files are monitored. These log file paths are relative to the EMC NetWorker installation directory (for example /nsr on UNIX and C:\Program Files\EMC NetWorker\nsr on Windows), unless the path is fully qualified as for the system logs.
| Log File | Description |
|---|---|
| On Solaris: | |
| logs/daemon.raw | NetWorker Progress Messages |
| /var/adm/messages | System Log |
| On HP-UX: | |
| logs/daemon.raw | NetWorker Progress Messages |
| /var/adm/syslog/syslog.log | System Log |
| On AIX/Linux: | |
| logs/daemon.raw | NetWorker Progress Messages |
| /var/log/messages | System Log |
| On Microsoft Windows: | |
| logs/daemon.raw | NetWorker Progress Messages |
| Events - Application/NetWorker | Windows Application Event Log |
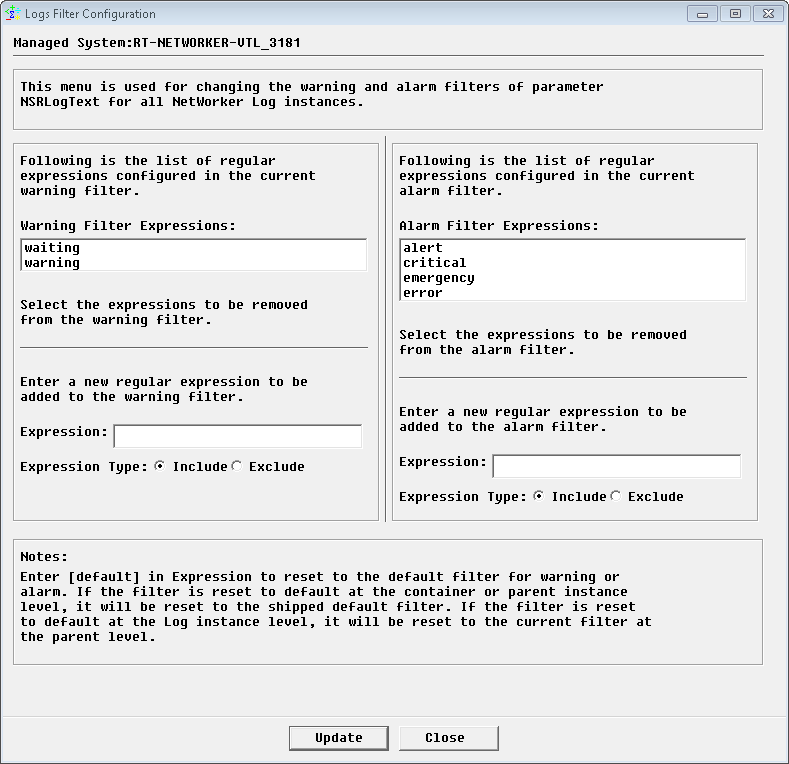
Configuring the Log Filter
A log error filter can be configured to specify the regular expressions that will generate a warning or an alarm. Each time the KM finds these expressions in a log file (or in NSRLogText), the error message will be written to the NSRLogAlarmText or NSRLogWarningText parameter. By default, the default log filter is configured for the EMC NetWorker progress and completion message file and the system log file. If you enabled additional log files for monitoring, you will have to customize the log filter by adding appropriate expressions for those log files.
| Error Expression | Set to Parameter | Status |
|---|---|---|
| alert | NSRLogAlarmText | Included |
| critical | NSRLogAlarmText | Included |
| emergency | NSRLogAlarmText | Included |
| error | NSRLogAlarmText | Included |
| waiting | NSRLogWarningText | Included |
| warning | NSRLogWarningText | Included |
For more information about the possible error messages, refer to the EMC NetWorker System Administrator’s Guide and the EMC NetWorker Troubleshooting Guide.
To configure the log error filter:
-
In the Console, right-click the Logs instance > KM Commands > Configuration > Logs Filter…
-
In the Warning Filter Expressions list, select the expressions that should be removed from the warning filter.
-
In the Alarm Filter Expressions list, select the expressions that should be removed from the alarm filter.
-
To add a new regular expression to the warning or alarm filter:
- In the Expression field, indicate the regular expression to be included (e.g.: skipping). Please note that regular expressions are case-sensitive.
- Select Include
-
To exclude a regular expression from the warning or alarm filter:
-
In the Expression field, indicate the regular expression to be excluded. You can also limit the exclusion to a particular expression already listed by using standard wildcard syntax.
-
Select Exclude
-
-
Click Update.

To revert to the default settings for either filter, type [default] as a new error expression for that filter, and click Update. If you revert to the default settings when accessed from the log instance level, the settings will revert to the parent or container instance level. To revert to the shipped default settings (as shown above), access this dialog from the log container instance. From this level you will also have the option to reset the configuration of any modified child instance.
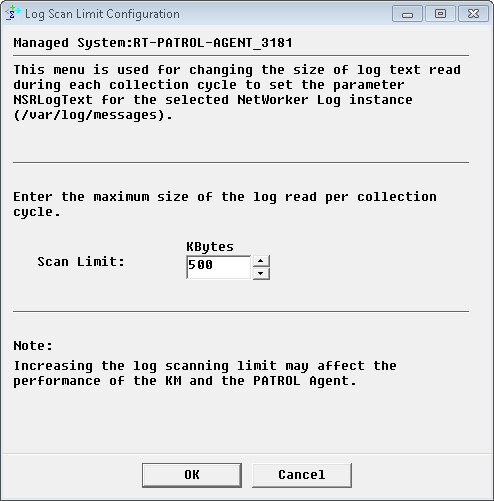
Configuring the Log Scan Limit
The EMC NetWorker KM scans log files by reading the new log entries since the last data collection cycle. By default, only 500 Kbytes of data is scanned for each log file during each data collection cycle. This log scan limit can however be modified to better suit your requirements.
To customize the log scan limit:
-
In the Console, right-click the Log(s) instance > KM Commands > Configuration > Log(s) Scan Limit…
-
Indicate the amount of data that will be read by the KM during each data collection cycle.
-
Click OK.

Configuring Databases
By default, the following database paths are monitored. These database paths are relative to the EMC NetWorker installation directory (for example /nsr on UNIX/Linux and C:\Program Files\EMC NetWorker\nsr on Windows).
On Solarix, HP-UX and Linux
| Database | Description |
|---|---|
| index | NetWorker Client File Index Database |
| mm | NetWorker Media Database |
| res/nsrdb | NetWorker Resource Database |
| res/nsrladb | NetWorker Client Execution Resource Database |
| res/jobsdb | NetWorker Jobs Database |
On AIX
| Database | Description |
|---|---|
| index | NetWorker Client File Index Database |
| mm | NetWorker Media Database |
| res/nsr.res | NetWorker Resource Database |
| res/nsrladb | NetWorker Client Execution Resource Database |
| res/jobsdb | NetWorker Jobs Database |
On Microsoft Windows
| Database | Description |
|---|---|
| index | NetWorker Client File Index Database |
| mm | NetWorker Media Database |
| res\nsrdb | NetWorker Resource Database |
| res\nsrladb | NetWorker Client Execution Resource Database |
| res\jobsdb | NetWorker Jobs Database |
Filtering Elements to Monitor
By default, the solution monitors all the elements discovered, which may represent an important workload to the agents and servers. Because the monitoring of some elements may be irrelevant for various reasons, you can apply filters to indicate which elements will be monitored or not.
To filter elements to monitor:
-
In the Console, right-click one of the following instances depending on the elements that you wish to monitor:
- Clients > KM Commands > Configuration > Clients… to filter the clients to be monitored
- Daemons > KM Commands > Configuration > Daemons… to filter the daemons to be monitored
- Databases > KM Commands Configuration > Databases… to filter the databases to be monitored
- Logs > KM Commands > Configuration > Logs… to filter the logs to be monitored. Only the daily messages file will be monitored on AIX and Microsoft Windows platforms since there is no ASCII format system log file to monitor
- Groups > KM Commands > Configuration > Groups… to filter the groups to be monitored. By default, only save groups that belong to these groups will be instantiated and monitored
- Pending Requests > KM Commands > Configuration > Pending Requests… to filter the pending requests to be monitored
- Jukeboxes > KM commands > Configuration > Jukeboxes… to filter the jukeboxes to be monitored
- Jukebox > KM Commands > Configuration > Jukebox Devices… to filter the jukebox devices to be monitored
- Save Groups > KM Commands > Configuration > Save Groups… to filter the save groups to be monitored
- Standalone Devices > KM Commands > Configuration > Standalone Devices… to filter the standalone devices to be monitored
- Storage Nodes > KM Commands > Configuration > Storage Nodes… to filter the storage nodes to be monitored
- Volume Pools > KM Commands > Configuration > Volume Pools… to filter the volume pools to be monitored
Note: These menus are also available from the child instances and will apply to all objects created under the child instances.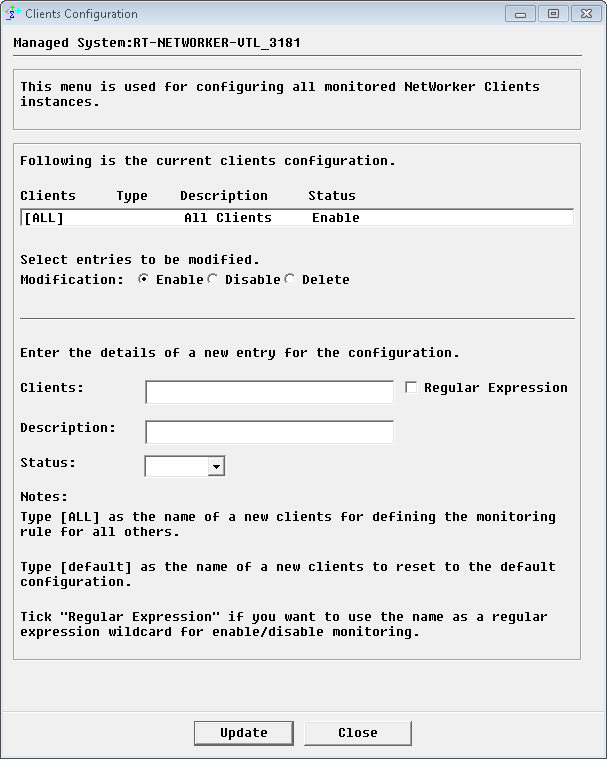
The
[ALL]entry ensures that all the elements found during PATROL discovery are instantiated and monitored. When installed on a Storage Node, the default configuration monitors only the discovered local jukeboxes and local standalone devices. This is covered by the[LOCAL]entry in the default configuration on a Storage Node. -
To enable elements for monitoring:
- In the current configuration list, select the elements to enable
- Select Enable
- Click Update
A log filter will have to be configured if you enable log files for monitoring.
-
To disable elements for monitoring:
- In the current configuration list, select the elements to disable
- Select Disable
- Click Update
All save groups associated to disabled policies are not monitored.
Disabled instances will be instantiated in an OFFLINE state. Commands will not be executed, thus leaving parameters not set.
-
To delete elements for monitoring:
- In the current configuration list, select the elements to delete
- Select Delete
- Click Update
-
To add a new element to monitor:
- Type the name of the element to be monitored (as it appears in the PATROL console) or a regular expression to be monitored
- If needed, enter a description
- From the Status list, select Enable
- Click Update.
To revert to the default monitoring configuration, type [default] as a new entry and click Update.
-
Resume the procedure for all the application classes for which you wish to apply monitoring filters.

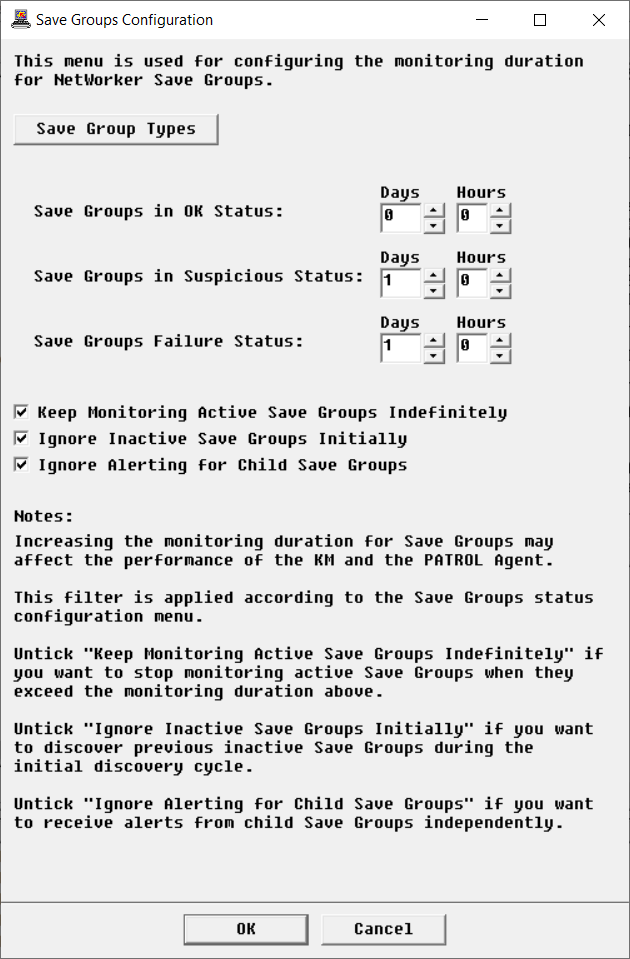
Configuring the Save Groups Monitoring
By default, EMC NetWorker KM monitors failed and suspicious save groups for 1 day. The successfully completed save groups are not monitored. You can however modify these settings to better suit your requirements.
-
In the Console, right-click the Save Groups instance > KM Commands > Configuration > Save Groups…
-
Click Save Group Types to indicate the save groups/jobs to be monitored in a comma-separated list. Click Accept. Leave this field blank to reset to the default configuration.
-
Indicate how long the save groups in OK, Suspicious, and Failure status will be monitored. If you:
- decrease the monitoring period, older save groups will be destroyed on the next data collection cycle
- increase the monitoring period, you will have to force a full data collection to ensure that all save groups are instantiated. To force the data collection, right-click the Save Groups instance > KM Commands > Force Full Collection…
-
Select:
- Keep Monitoring Active Save Groups Indefinitely if you want to endlessly monitor active save groups
- Ignore Inactive Save Groups initially if you want the inactive save groups not to be created in the initial discovery cycle. Initially discovering and monitoring inactive save groups may impact the performance of the application
- Ignore Alerting for Child Save Groups if you do not want to be notified when a save group failure occurs on child jobs.
-
Click OK.

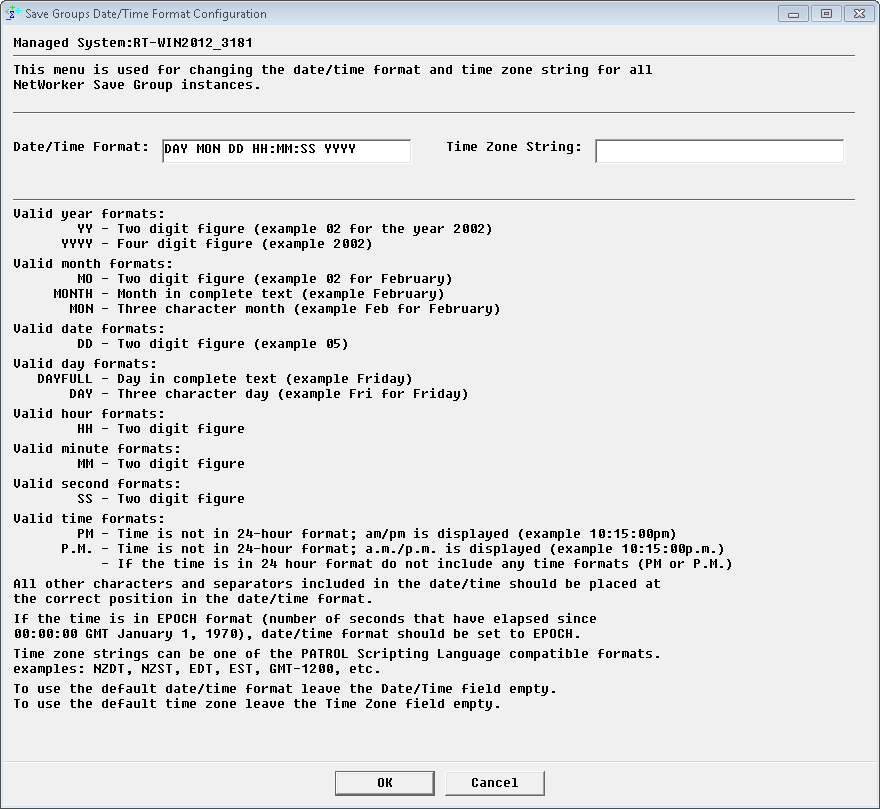
Configuring the Save Groups Date/Time Format
The EMC NetWorker KM uses EMC NetWorker commands to determine the date and time of each save group (used for calculating the elapsed time since the save group was triggered). Depending on your local system time zone and date/time format, the application may return a different date/time format.
To customize the save group date/time format:
-
In the Console, right-click the Save Groups instance > KM Commands > Configuration > Save Groups Date/Time Format…
-
Indicate the expected Date/Time Format.
-
Indicate a PSL-compatible Time Zone String (e.g.: NZDT, NZST, EDT, EST, GMT-1200, etc.).
-
Click OK.

The new date/time format is then applied to all save groups.
To revert to the default settings, blank out the Date/Time Format field and/or the Time Zone String field and click OK. The time zone field used will be the local time zone on the managed node.
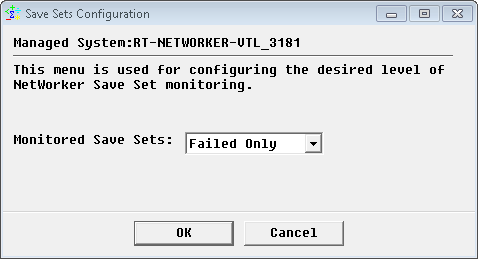
Configuring the Save Sets Monitoring
By default, EMC NetWorker KM for PATROL only monitors the failed save sets. This setting can however be modified to include successful save sets.
-
In the Console, right-click the Save Groups icon > KM Commands > Configuration > Save Sets…
-
From the Monitored Saved Sets list, select the desired level of monitoring:
- None: to disable the save clients monitoring feature
- Failed Only (default): to only monitor failed save clients
- Succeed Only: to only monitor successful save clients
- All: to monitor all the save clients
-
Click OK.

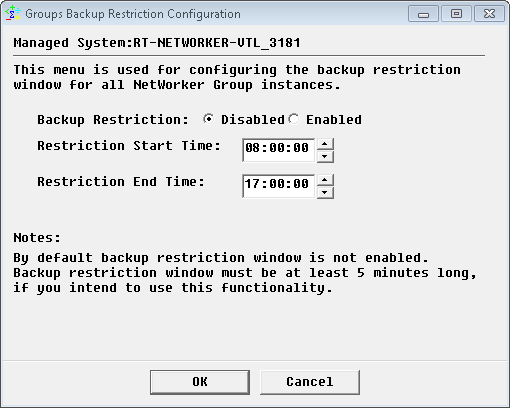
Configuring the Group Backup Restriction Window
EMC NetWorker KM can be configured to trigger an alert when a backup is started during a specific period of time:
-
In the Console, right-click:
- the Groups instance > KM Commands > Configuration > Groups Backup Restriction… to apply this customization to all group backups
- a Group instance > KM Commands > Configuration > Group Backup Restriction… to apply this customization to a specific group backup
-
Select Enabled.
-
Indicate the Restriction Start and End Time. The restriction window should at least last 5 minutes.
-
Click OK.

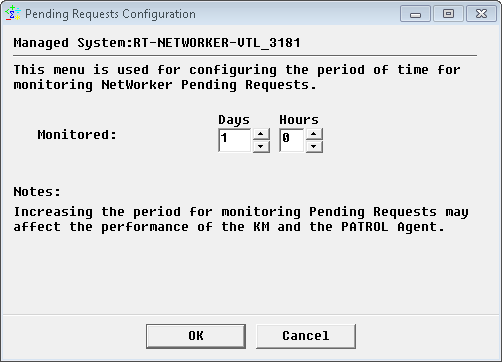
Configuring the Pending Requests Monitoring
By default, EMC NetWorker KM monitors pending requests for 1 day. You can however modify these settings to better suit your requirements.
-
In the Console, right-click the Pending Requests instance > KM Commands > Configuration > Pending Requests…
-
Indicate how long the pending requests will be monitored. If you decrease the monitoring period, older pending requests will be destroyed on the next data collection cycle
-
Click OK.

Configuring the Pending Requests Date/Time Format
The EMC NetWorker KM uses EMC NetWorker commands to determine the date and time of each pending mount request (used for calculating the elapsed time since the mount request was issued). Depending on your local system time zone and date/time format, the application may return a different date/time format.
To customize the pending request date/time format:
-
In the Console, right-click the Pending Requests instance > KM Commands > Configuration > Pending Requests Date/Time Format…

-
Indicate the expected Date/Time Format.
-
Indicate a PSL-compatible Time Zone String (e.g.: NZDT, NZST, EDT, EST, GMT-1200, etc.).
-
Click OK.

The new date/time format is then applied to all pending requests.
To revert to the default settings, blank out the Date/Time Format field and/or the Time Zone String field and click OK. The Time zone field used will be the local time zone on the managed node.
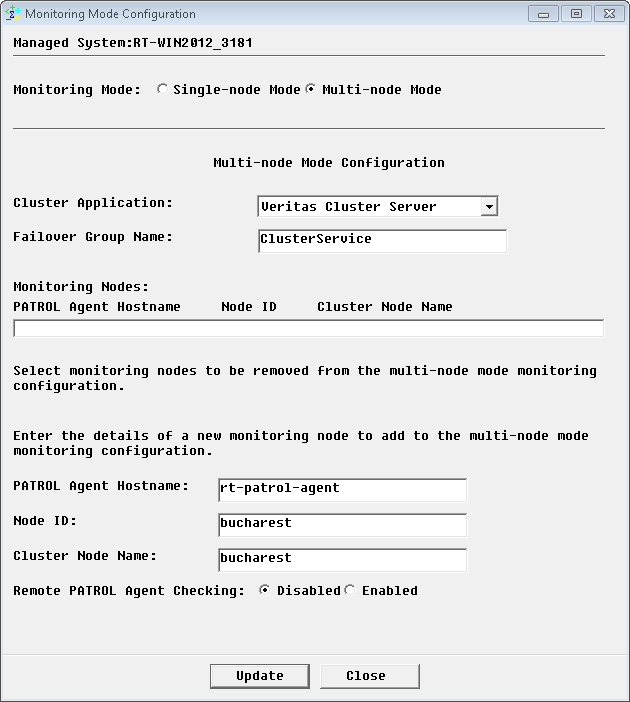
Configuring the Multi-Node Monitoring Mode
When EMC NetWorker is installed in a cluster environment, i.e. active on one cluster node and passive on others, false alarms and duplicate alerts may occur. To avoid such situation, users need to configure EMC NetWorker KM for PATROL in multi-node monitoring mode, if NetWorker is installed in a supported cluster.
To configure the multi-node monitoring mode:
-
In the Console, right-click the server instance > KM Commands > Configuration > Monitoring Mode…
-
Select Multi-node Mode.
-
From the Cluster Application pull-down list, select an appropriate cluster application.
-
In the Failover Group Name field, enter the failover group name, which is online on one cluster node and offline on the others. Leave this field blank if you previously selected Veritas Cluster File System. The EMC NetWorker KM will then monitor the entire cluster from the active master system, which is identified by the
vxdctl -c modecommand. This method requiresvxconfigdin enable mode with its clustered state active. -
Provide the details of all managed nodes of the cluster to be configured in the multi-node mode:
- PATROL Agent Hostname: host where the PATROL Agent is installed
- Node ID: the unique ID of the NetWorker node as configured in the KM menu EMC NetWorker instance > KM Command > Configuration > NetWorker Nodes
- Cluster Node Name: the hostname defined in the selected Cluster Application.
-
Click Update.
-
Resume the procedure for all the other NetWorker nodes and click Update.
-
Check the Remote PATROL Agent Checking option if there are more than one PATROL Agent involved in the multi-node mode configuration above. If enabled, the KM queries the other PATROL Agents to check the monitoring status of other nodes.
-
Click Close.
-
If the Remote PATROL Agent Checking is Enabled, you will have to provide all the information required to communicate with the PATROL Agents (protocol, port number, credentials, attempts and timeout).
-
Click Close.

The NetWorker server will then be monitored through the master or online node in Active Multi-node Mode. The other nodes, which are standing by for a failover, will be in Passive Multi-node Mode, monitoring only the components that are not visible from the active node.
If a managed node is unable to check the monitoring status of the active managed node, it will change to Temporary Single-node Mode allowing full monitoring. It will remain in Temporary Single-node Mode until it finds the active node in full monitoring mode again.
If the Remote PATROL Agent Checking is Disabled, while there are more than one PATROL Agent involved, the managed node on the master or online node will be in Active Multi-node Mode and all others will be in Passive Multi-node Mode, without checking the monitoring status of the active node. In addition, the above procedure to configure Multi-node Mode (server instance > KM Commands > Configuration > Monitoring Mode) needs to be repeated from each PATROL Agent involved.
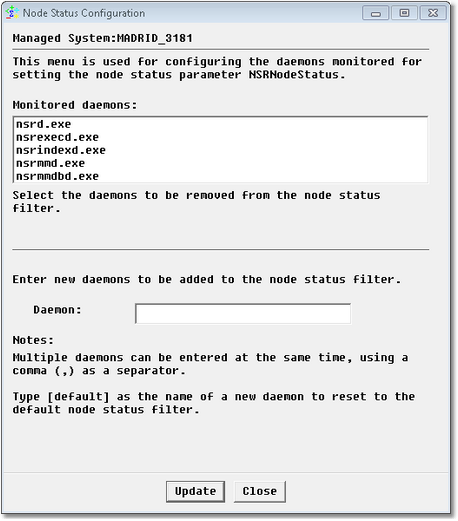
Configuring the Node Status
EMC NetWorker KM allows you to choose which daemons will be used to determine the node status:
-
In the Console, right-click the Server instance> KM Commands > Configuration > Node Status…
-
In the Monitored daemons list, select the daemons that will not be used to determine the node status
-
In the Daemon field, list the daemons to be used to determine the node status. The Daemon list must be comma-delimited.
-
To use default settings, type
[default]in the Daemon field -
Click Update.
The NSRNodeStatus parameter will then be set to:
- Suspicious if any command run by the EMC NetWorker KM returns a server error message
- Failure if any configured daemon is not running.

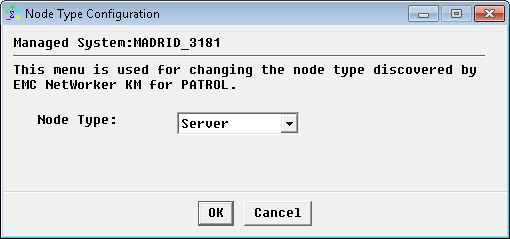
Configuring the Node Type
You may have to manually indicate the type of node monitored if the discovery fails to recognize it:
-
In the Console, right-click the server instance > KM Commands > Configuration > Node Type…
-
Select the node type (Server or Storage Node)
-
Click OK.
