|
This use case explains how to download a standard Nagios Plugin from the Internet, import it to Monitoring Studio v.9.4.00 and execute it from your PATROL Classic console.
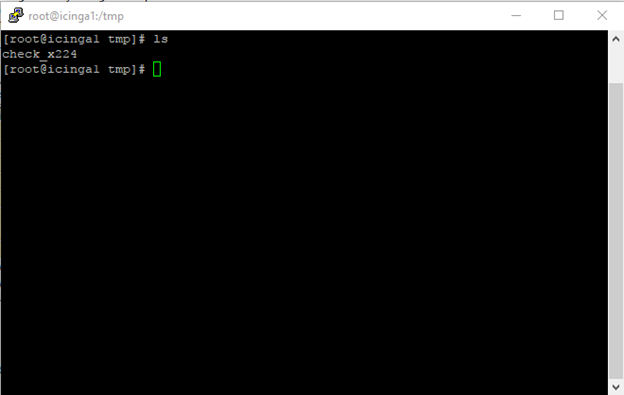
| 2. | Download the plugin on your local machine and then transfer it to a PATROL Agent Server through the FTP client running on Monitoring Studio v.9.4.00 (Host = ICINGA1 in this example). |
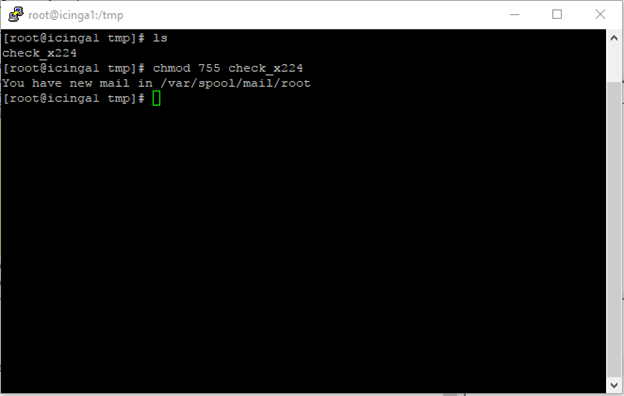
| 3. | Provide the execution right to execute the plugin locally on the server with the chmod 755 command: chmod 755 check_x224. |
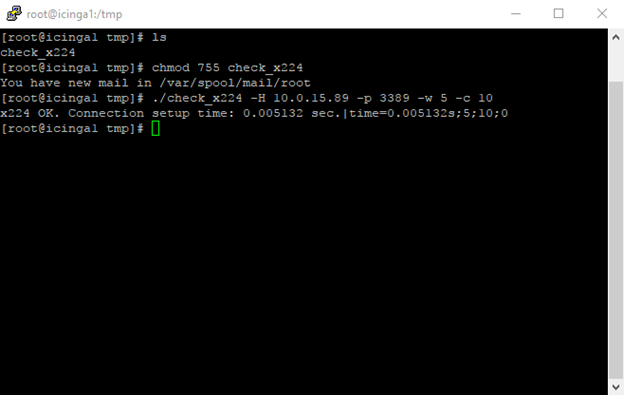
| 4. | Execute the plugin, to verify that it is running properly: ./check_x224 -H 10.0.15.89 -p 3389 -w 5 -c 10. |
 Monitoring Studio v.9.4.000 will not be able to execute the plugin if it does not run successfully on the server where it is downloaded and deployed. Monitoring Studio v.9.4.000 will not be able to execute the plugin if it does not run successfully on the server where it is downloaded and deployed.
Once the plugin runs successfully, you can configure Monitoring Studio 9.4.00.
| 5. | Create a Group on the ICINGA1 host. |
| 6. | Create a Nagios Plugin Monitor by right-clicking the Host > KM Commands > New > Monitor... |
| 7. | Select Nagios Plugin from the drop-down list and click Next. |
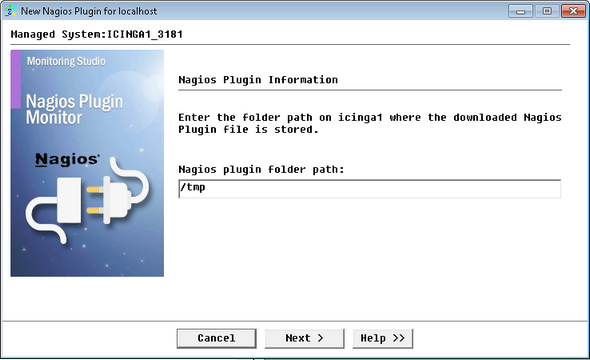
| 8. | Provide the path to the Nagios Plugin: /tmp in this example. |
| 9. | Provide the arguments used previously to test the plugin: check_x224 -H 10.0.15.89 -p 3389 -w 5 -c 10. |
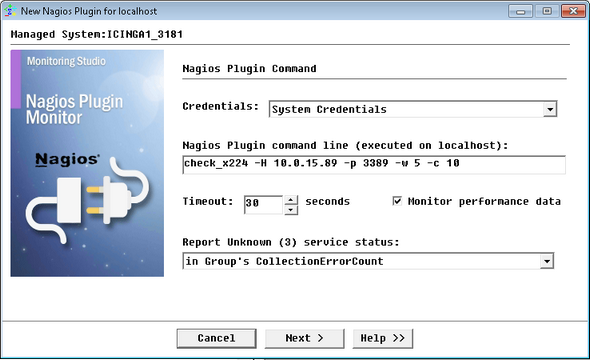
| 10. | Click Next to continue. |
| 11. | Keep the default settings for the Nagios Performance Data. |
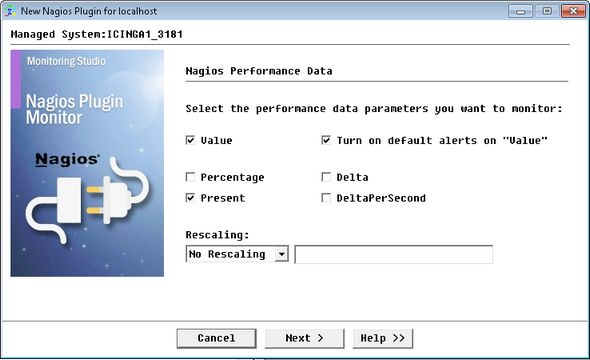
| 12. | Click Next to continue. |
| 13. | Keep the default settings for the Missing Performance Data Detection. |
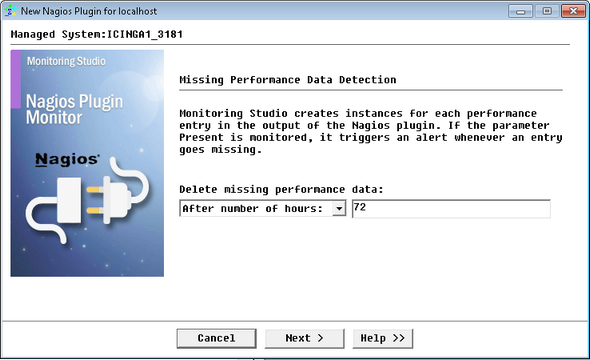
| 14. | Click Next to continue. |
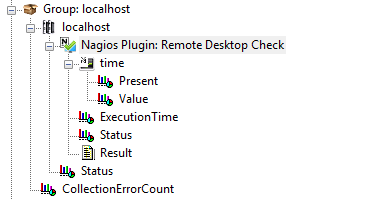
| 15. | Provide a Display Name for the Nagios Plugin Monitor: Remote Desktop Check, in this example. |
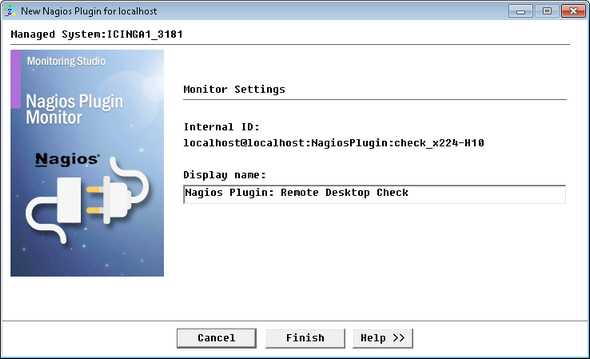
| 17. | The Nagios Plugin Monitor is created and displayed in the PATROL Console. |
Refer to the Executing Nagios Plugins chapter for detailed information about the Nagios Plugins Monitor settings and to the SEN_MS_NAGIOSPLUGIN chapter for a list and a description of the parameters collected by the Monitor.
| 

