|
Monitoring Studio provides powerful monitoring capabilities to support your existing custom scripts built for Nagios. Through Nagios Plugin Monitors, Monitoring Studio extends the monitoring coverage of your IT environment by supporting any existing Nagios Plugins. This Monitor is designed to execute any Nagios Plugin and monitor the results directly from your PATROL console without requiring a native Nagios environment.
 To import an entire Nagios configuration, please refer to the Importing Nagios Configuration topic. To import an entire Nagios configuration, please refer to the Importing Nagios Configuration topic.
By default, alert actions are set at the Nagios Plugin Monitor level and shared by all Nagios Performance Data instances below.
To set different alert actions for a specific Nagios Performance Data instance, you need to create a separate Nagios Plugin Monitor and then specify the alert actions that will only apply to all its related Nagios Performance Data instances.
To monitor Nagios plugins
| 1. | In the PATROL Console, right-click the Host icon and select KM Commands > New > Monitor... |
| 2. | Select Nagios Plugin from the drop-down list and click Next. |
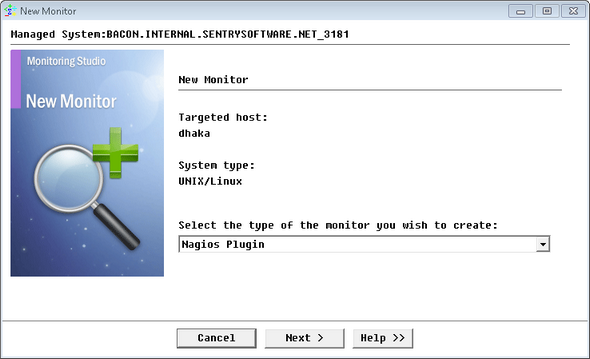
Executing Nagios Plugins - Nagios Plugin Monitor Type Selection
| 3. | Enter the path of the folder where the required Nagios plugin file is stored and click Next. |
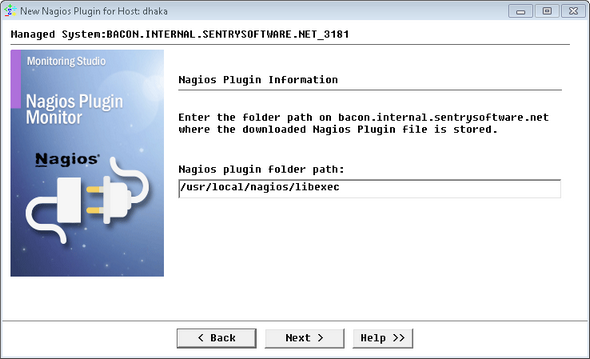
Importing Nagios Plugins - Nagios Plugin Folder
| 4. | Configure the Nagios Plugin command line to be executed: |
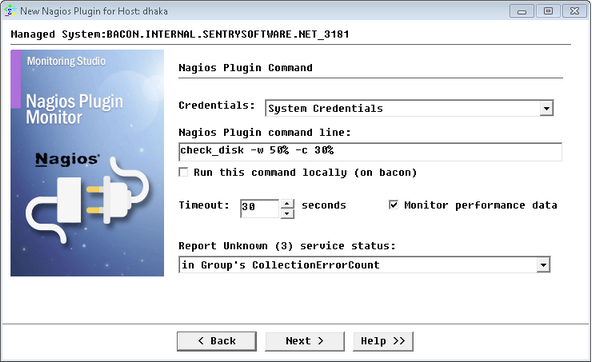
Importing Nagios Plugins - Nagios Plugin Command Line Configuration
| ▪ | Credentials: Select from the drop-down list the type of credentials that you want to use for the command line execution: |
| • | Agent's Default Account: Uses the PATROL Agent credentials for executing Nagios plugin commands on the local Nagios server. The Run this command locally option should also be selected to launch the command/plugin execution on the local PATROL Agent system. |
| • | System Credentials (default): Uses the credentials previously specified when creating the Host. |
| • | Add new credentials...: Lets you set new credentials for this specific monitoring. Refer to the Setting Credentials chapter for detailed information. |
| ▪ | Enter the Nagios Plugin command line to execute. |
| ▪ | Run this command locally (on <PATROL Agent's host>): Select this option if you want the command line to be executed on the PATROL Agent's system and not on the targeted host. |
| ▪ | Timeout: Enter the time in seconds after which the command will be stopped (Default: 30 seconds). If the timeout is reached, a new error is logged in CollectionErrorCount parameter of the monitored group, indicating that the command failed to execute properly. |
| ▪ | Monitor Performance Data: Check this option if you want each performance data returned by the plugin to be instantiated and monitored. |
| ▪ | Report Unknown (3) service status: Select how you want an unknown status to be reported in PATROL: |
| • | as a new error in the CollectionErrorCount parameter of the monitored Group. |
| • | as a specific value in the Status parameter. |
| 5. | Select the parameters to be monitored. Refer to the SEN_MS_NAGIOSPERF chapter for details on parameters. |
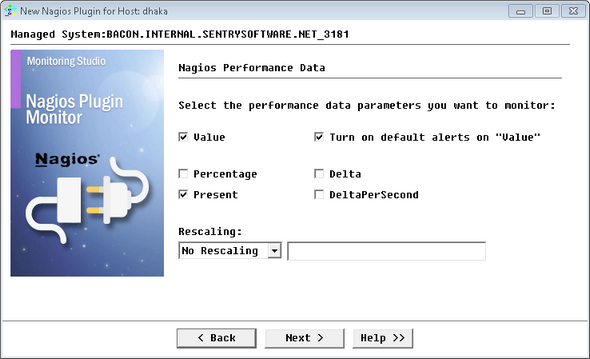
Importing Nagios Plugins - Performance Data Parameter Selection
| • | Use the Rescaling option to rescale the value retrieved in order to have a more readable graph in the PATROL console: |
| • | No Rescaling: The value remains unchanged and is reported as collected. |
| • | Convert to MB: The value is converted into megabytes. |
| • | Convert to GB: The value is converted into gigabytes. |
| • | Convert to TB: The value is converted into terabytes. |
| • | Divide by the value below: The value is divided by the number you provide. |
| 7. | Specify a time after which Nagios Performance instances with missing performance data will be deleted: |
| ▪ | After number of hours: Enter the number of hours after which the instance will be deleted. |
| ▪ | Never: To prevent instances with missing performance data to be deleted. |
| ▪ | Immediately: To delete instances with missing performance data immediately. |
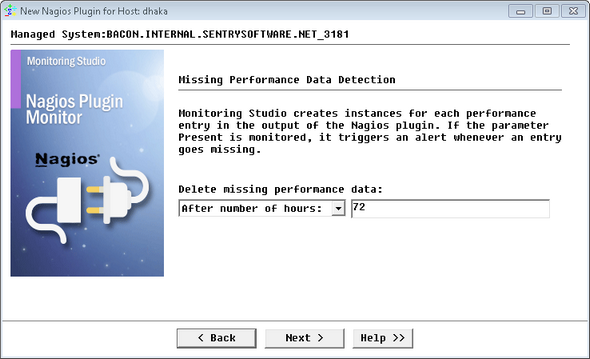
Importing Nagios Plugins - Configuring Missing Performance Data Deletion
| 10. | Click Finish. The corresponding Nagios Plugin instance (Nagios Plugin: <Display Name>) is created in the PATROL Console. The collected parameters for Nagios Plugin instances are listed in the SEN_MS_NAGIOSPLUGIN chapter. |
| 

