|
WMI (Windows Management Instrumentation) is the Microsoft implementation of WBEM (Web Based Enterprise Management) that provides users with information about the status of local or remote computer systems.
Monitoring Studio can execute WMI queries on your system and consolidate them within your PATROL environment along with the technology monitoring under a single icon. It can also query the WMI repository for class and instance information. You can for example query the WMI that returns all the objects representing shut-down events from your desktop system.
 This function is only available on Windows hosts. It can be remotely used from PATROL Agents running on Windows only. This function is only available on Windows hosts. It can be remotely used from PATROL Agents running on Windows only.
To execute a WMI query
| 1. | In the PATROL Console, right-click the Host or Monitor Group icon and select KM Commands > New > Monitor... |
| 2. | Select WMI Query from the drop-down list and click Next. |
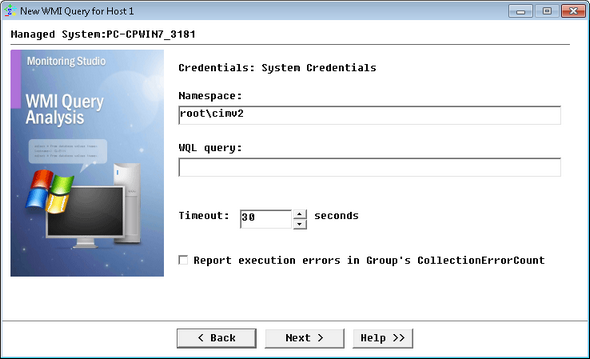
Please note that the System Credentials entered at the host level will be used to retrieve WMI Queries information.
Analyzing WMI Queries - WMI Query Information
| ▪ | Namespace: Enter the WMI namespace. A namespace is a logical group of related classes representing a specific technology or area of management (Example: root\cimv2). |
| ▪ | WQL Query: Enter your query. (Example: SELECT DeviceID,Speed,Description,PermanentAddress,OperationalStatus FROM HPUX_EthernetPort). If you need help to build your WMI query, download WMI CIM Studio, which is one of the WMI Administrative tools on the Microsoft site. |
| 4. | Provide the following WMI Query Information: |
| ▪ | Timeout : Specify the time in seconds after which the query will be stopped (Default: 30 seconds). If the query times out, the Status parameter will be set to 2 (Failed) and an alarm will be triggered. |
| ▪ | Report execution errors in Group's CollectionErrorCount: Select this option to have the CollectionErrorCount parameter of the Group reflect possible alerts triggered upon the query execution. The CollectionErrorCount parameter of the Group reports on the collection errors of any Monitor, associated to the group, for which this option is available and selected, providing a global view of the collection errors for the whole Group. |
| 7. | Click Finish. The corresponding WMI Query instance (WMI Query: <Display Name>) is created in the PATROL Console. The collected parameters for WMI Query instances are listed in the SEN_MS_WMIQUERY chapter. |
You can now run String Searches and Extract Numeric Values on the WMI query result output.
|


