-
Home
- TrueSight
Operate in TSPS
Once Veritas Cluster Server KM has been successfully installed and configured, you can:
- View the Veritas Cluster Server device in TrueSight
- View the events triggered
- Create dashboards.
Viewing the Veritas Cluster Server Device in TrueSight
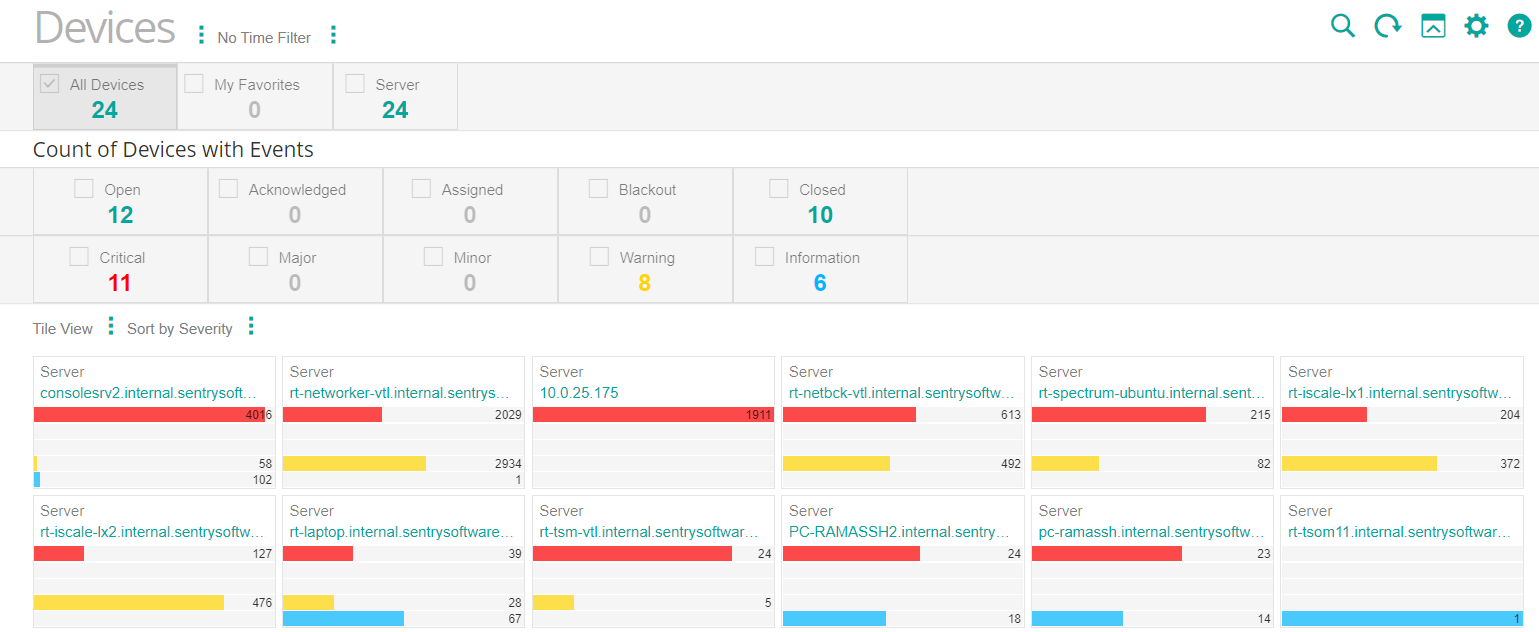
The Veritas Cluster Server system will appear as a separate device in the TrueSight Devices view.
- Log on to the TrueSight console
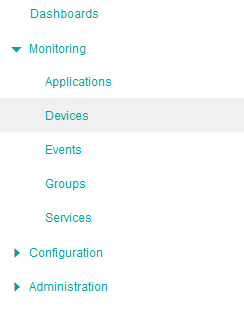
- In the navigation pane, expand Monitoring and select Devices
-
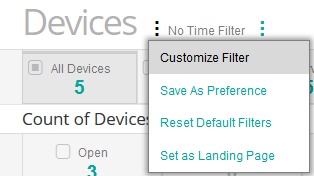
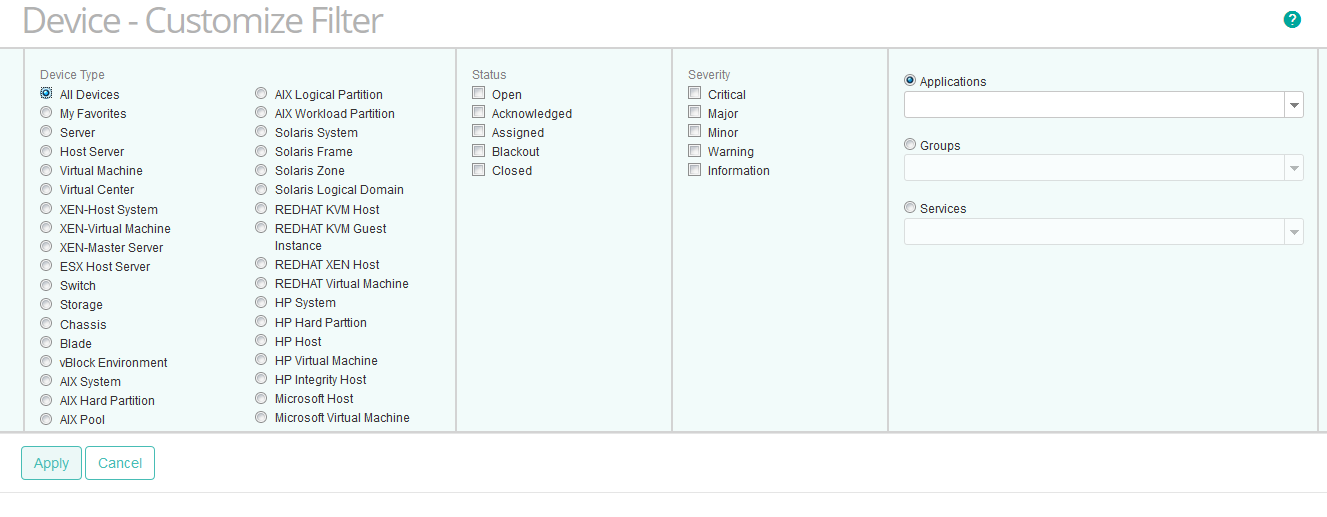
Customize the Device Filter to display all your Devices
-
Click the action button

-
Select All Devices and click Apply
-
-
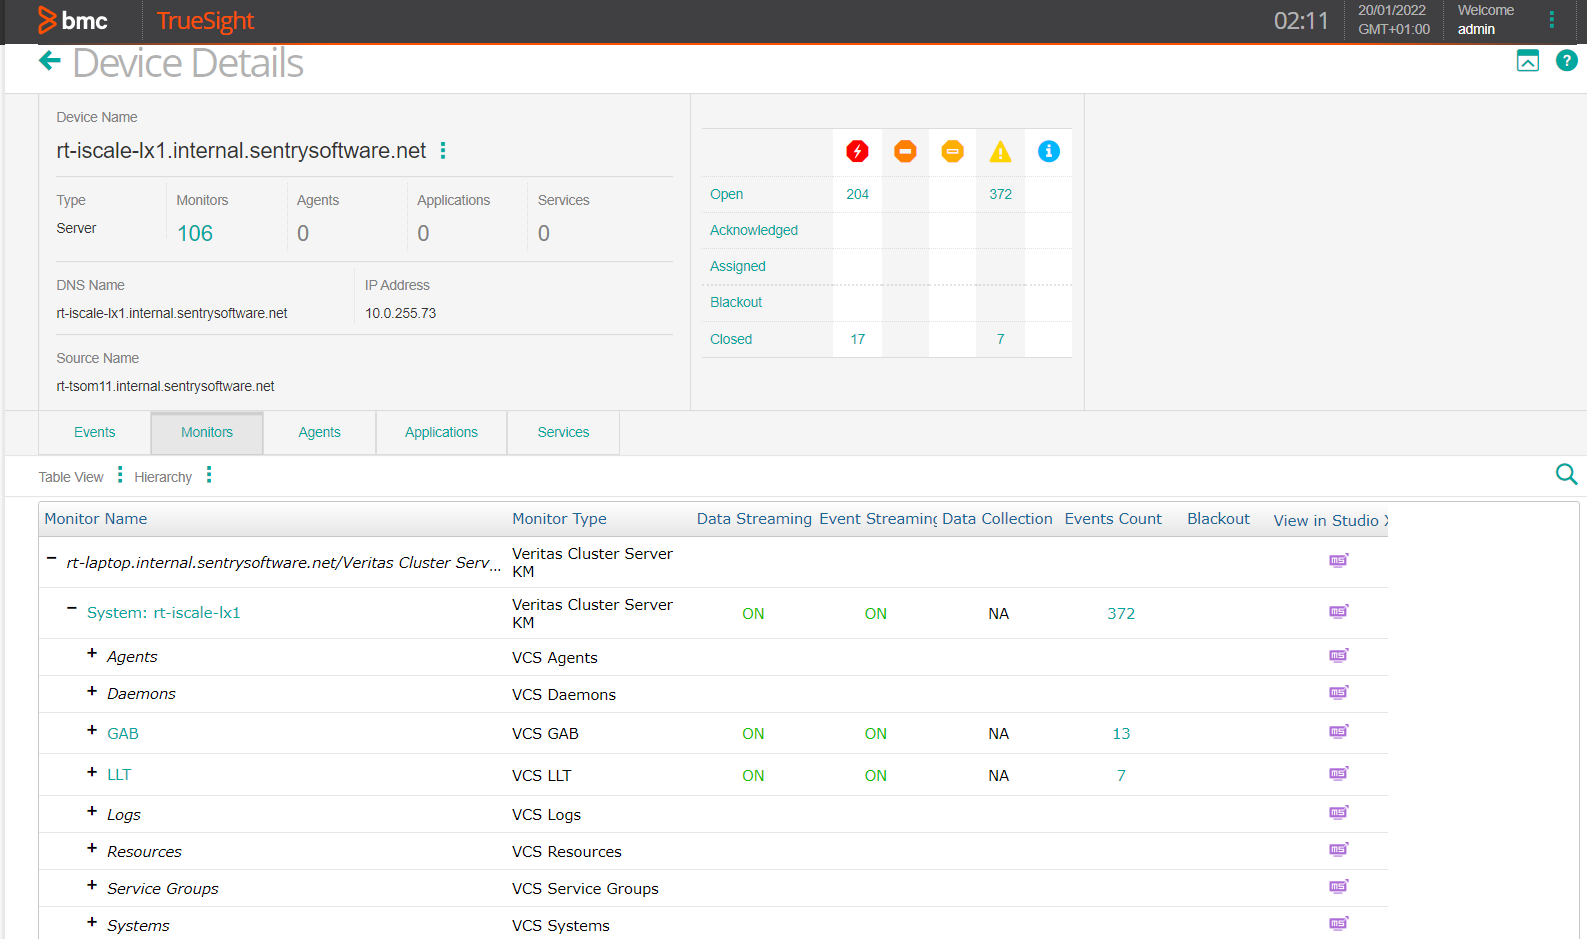
Click the Veritas Cluster Server device. In our example, rt-iscale-lx1.internal.sentrysoftware.net
-
Expand the Veritas Cluster Server Monitor to display all its instances.
-
Double-click the attribute of your choice to display the graph.


Viewing the Events Triggered
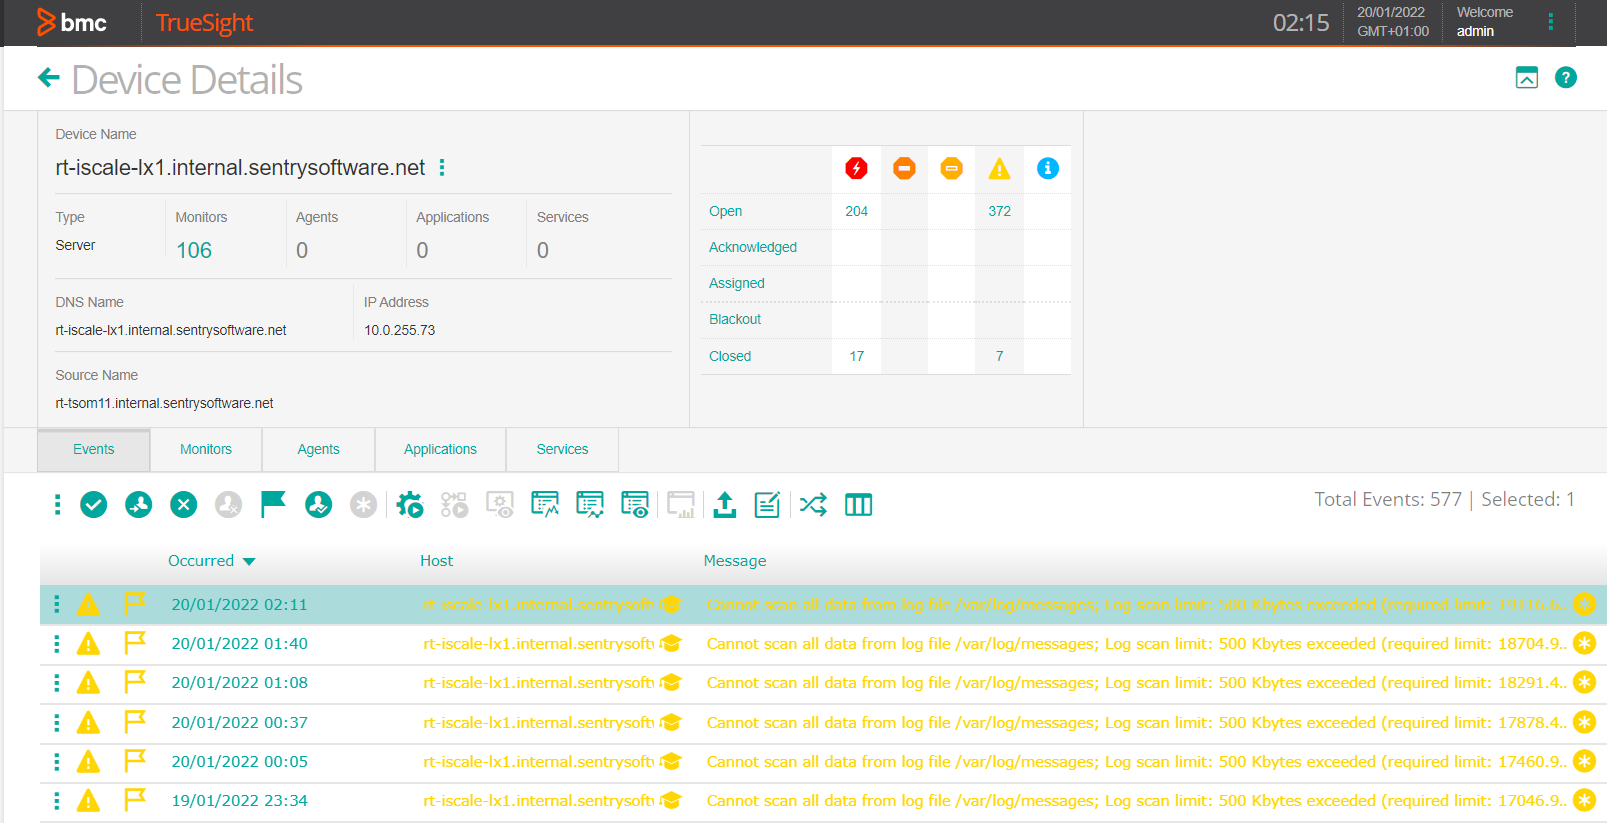
To display all the events that are associated with the Veritas Cluster Server device:
-
View the Veritas Cluster Server Device in TrueSight
-
Click the Events tab.

Creating Dashboards
BMC TrueSight Operations Management provides dashboards to create consolidated and customized views of your monitored IT environment. Dashboards are built from dashlet templates. Once you have selected the dashlet that corresponds to the type of view you wish to create, you can access a specific type of data and present it graphically.
Veritas Cluster Server KM monitors your Veritas Cluster Server environment to ensure it runs efficiently 24 hours a day. The data is available through different dashlets to allow you to create a clear view of your Veritas Cluster Server environment within a private or shared dashboard. Refer to the BMC TrueSight documentation to learn how to create dashboards.