|
Guarantying optimal server, application, or any technology performance cannot only rely on monitoring system resources such as CPU or memory utilization, storage space availability or temperature levels. The performance of each process underlying critical technologies needs to be accurately evaluated to understand the origin of the load on a system.
The Process Monitor is designed to identify and monitor any process running on the servers of your IT environment, locally or remotely.
To monitor Windows, UNIX, or Linux processes, simply specify one or more of the following criteria:
| • | The process name (as it appears in ps or in the Windows Task Manager) |
| • | The Command line that was used to spawn the process |
| • | The Username the process is run as |
| • | The PID file path that contains the process ID |
 While the first 3 criteria can be combined to identify a process, the PID must always be used alone. While the first 3 criteria can be combined to identify a process, the PID must always be used alone.
To monitor a process
| 1. | Access the Monitoring Studio Configuration panel, as explained in the Configure Monitors chapter. |
| 2. | In the Monitors section, click the Processes button. |
| 3. | The Processes panel is displayed to define the process monitoring settings and specify the process detection details method. |
| 4. | Define the Detection by Process Details information: |
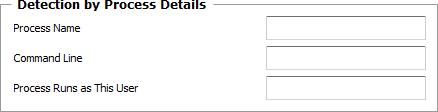
Processes — Detection by Process Details
| ▪ | Process Name: Enter the name of the process you wish to monitor (including the extension for Windows processes). |
| ▪ | Command Line: Specify the command line that launched the process. |
| ▪ | Process Runs as This User: Enter the username the monitored process is running as. |
Examples of settings for detection by process details
|
|
|
Example 1
|
| • | Process name MUST BE EXACTLY patrolagent.exe |
| • | Command-line = <nothing> |
| • | User Identity = <nothing> |
|
PatrolAgent.Exe
C:\Patrol\PatrolAgent.exe -p 3181
C:\Patrol\PatrolAgent.exe
|
Example 2
|
| • | Process name MUST BE EXACTLY patrolagent.exe |
| • | Command-line MUST MATCH THE REGULAR EXPRESSION -[pP] 3181 |
| • | User Identity = <nothing> |
|
C:\Patrol\PatrolAgent.exe -p 3181
|
Example 3
|
|
| • | Process name MUST CONTAIN Pat |
| • | Command-line = <nothing> |
| • | User Identity = <nothing> |
|
PatrolAgent.exe
PatProcess.exe
PatrolPerf.exe
|
 To monitor all processes of a selected user, enter only the "User Identity" and leave "Process name" and "Command-line" empty. To monitor all processes of a selected user, enter only the "User Identity" and leave "Process name" and "Command-line" empty.
 Search criteria are case-sensitive on UNIX and Linux. Search criteria are case-sensitive on UNIX and Linux.
None of the details listed above are mandatory, but at least one of them must be specified.
| 5. | Or, define the Detection by PID File option. Some technologies record their PID (process ID) in a pre-defined file. To make sure these technologies are operating properly, Monitoring Studio can read the PID from this file and monitor the corresponding process. |
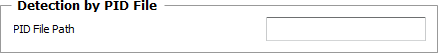
Processes — Detection by PID File
| ▪ | PID File Path: Enter the path of the PID file. At each polling, the solution reads this file, retrieves the PID number and checks whether this process PID exists or not. Normally, the process PID is dynamically allocated. The process PID number should be at the very beginning of the file’s content. |
| 6. | Enable/Disable the Child Processes option: |
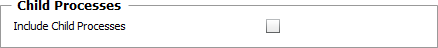
Processes — Detection by PID File
| • | Include Child Processes: Select this option to have Monitoring Studio include the child processes associated to the current main process in the calculation of the process performance statistics. |
| 7. | Configure the Status Interpretation settings (UNIX/Linux only). This feature allows you to qualify the Status attribute of a process according to its state. The solution can then trigger an alert according to the Status attribute value. For example, if you apply Suspicious to the Status attribute for the Stopped state, an alert (Warning) will be triggered when the process is stopped and its Status attribute will be set to Suspicious. |
| ▪ | Optional — For each of the process possible state, select the value of the Status attribute: OK, Suspicious or Failed. By default, the overall process state will be interpreted as listed in the table below: |
|
|
|
Running
|
OK
|
Sleeping
|
OK
|
Queued
|
OK
|
Waiting
|
OK
|
Intermediate
|
OK
|
Stopped
|
Suspicious
|
Growing
|
Suspicious
|
Unknown
|
Suspicious
|
Terminated
|
Failed
|
Not Running
|
Failed
|
| 8. | Define the Monitor Settings: |
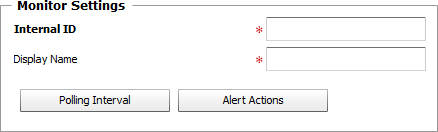
Processes — Monitor Settings
| ▪ | Internal ID: Enter an ID to identify the monitored process in TrueSight Operations Management. |
| ▪ | Display Name: Enter a name to identify the monitored process in TrueSight Operations Management. |
| ▪ | Optional — Polling Interval: Set the frequency at which the data collection will be performed. Default is 2 minutes. |
| ▪ | Optional — Alert Actions: Define the action(s) Monitoring Studio needs to perform when the thresholds for this managed process instance is breached. |
| 9. | Set the Process Cache time. Monitoring Studio relies on a cache mechanism to share the information among the Monitors in order to use as little resources as possible on the target host and over the network. The cache will be refreshed if one of the Monitors needs to collect data (polling interval reached) and the cache is older than the selected minimum cache refresh. |
Processes — Monitor Settings
| ▪ | Minimum Cache Refresh (seconds): Collected process data are cached to the namespace under each monitored Host instance. These data are shared between other process Monitors under the same Host. A cache most recent than this value will not be refreshed even if a collector tries to refresh it. Enter the number of seconds after which the cache will be refreshed. Default is 15 seconds. |
| 10. | Click the Add to List button to complete the creation of the process instance. |
|


