|
Monitoring Studio provides powerful monitoring capabilities to support your existing custom scripts built for Nagios. Through Nagios Plugin Monitors, Monitoring Studio extends the monitoring coverage of your IT environment by supporting any existing Nagios Plugins. This Monitor is designed to integrate with the Nagios server, execute any Nagios Plugins and monitor the results directly from your BMC TrueSight Operations Management environment.
To monitor Nagios plugins
| 1. | Access the Monitoring Studio Configuration panel, as explained in the Configure Monitors chapter. |
| 2. | In the Monitors section, click the Nagios Plugin button. |
| 3. | Provide the required information to define the Nagios plugin credentials that you want to use to execute a command line: |
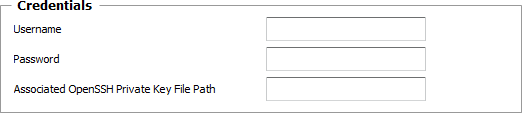
Nagios Plugins - Credentials Settings
| ▪ | Username: Enter the username to use to execute the command line. |
| ▪ | Password: Enter the password to use to execute the command line. |
| ▪ | Optional — Associated OpenSSH Private Key File Path: When monitoring remote hosts running UNIX, Linux or other types of operating systems that support SSH authentication key file, you may need to provide an OpenSSH private key file to establish a secured connection with the remote host. Enter the path of the OpenSSH private key file you wish to use to establish a connection with the remote host and enter the optional PassPhrase in the Password field. |
 The Private Key File should exists on the PATROL Agent node. The Private Key File should exists on the PATROL Agent node.
| 4. | Provide the required information to configure the Nagios plugin settings: |
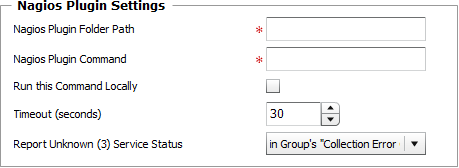
Nagios Plugins — Settings
| ▪ | Nagios Plugin Folder Path: Enter the path to the folder where the Nagios plugin files are stored. For example: /usr/local/nagios/libexec. |
| ▪ | Nagios Plugin Command: Enter the command line to execute. For example: check_disk -w 50% -c 30%. |
| ▪ | Run this Command Locally: Check this option if you want the command line to be executed on the PATROL Agent's system and not on the targeted host. |
| ▪ | Timeout (seconds): Enter the time in seconds after which the command will be stopped (Default: 30 seconds). If the timeout is reached, a new error is logged in Collection Error Count attribute of the monitored group, indicating that the command failed to execute properly. |
| ▪ | Report Unknown (3) Service Status: Select how you want an unknown status to be reported in your TrueSight Operations Management environment: |
| • | as a new error in the Collection Error Count attribute of the monitored group. |
| • | as a specific value in the Status attribute. |
| 5. | Configure the Performance Data Settings: |
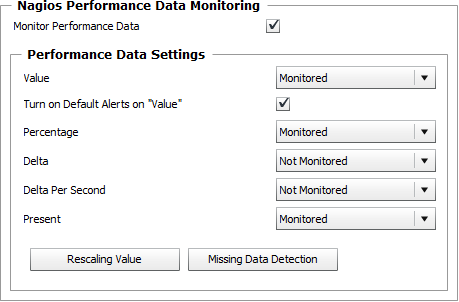
Nagios Plugins — Performance Data Settings
| 6. | Monitor Performance Data: Check this option if you want each performance data returned by the plugin to be instantiated and monitored. |
| 7. | Indicate if you wish the following attributes to be monitored or not: Value (Optional — Check the Turn on Default Alerts on "Value" option to use the default alerts for the Value attribute based on the returned performance data), Percentage, Delta, Delta Per Second, Present. |
| 8. | Click the Rescaling Value button to customize the way Monitoring Studio will report on the retrieved value: |
| ▪ | No Rescaling: The value remains unchanged and is reported as collected. |
| ▪ | Convert to MB: The value is converted into megabytes. |
| ▪ | Convert to GB: The value is converted into gigabytes. |
| ▪ | Convert to TB: The value is converted into terabytes. |
| ▪ | Divide by the Value Below: The value is divided by the number you provide. |
| 9. | Click the Missing Data Detection button to specify a period of time after which Nagios Performance instances with missing performance data will be deleted: |
| ▪ | After the Number of Hours Specified Below: Enter the number of hours after which the instance will be deleted. |
| ▪ | Never: To prevent instances with missing performance data to be deleted. |
| ▪ | Immediately: To delete instances with missing performance data immediately. |
| 10. | Define the Monitor Settings: |
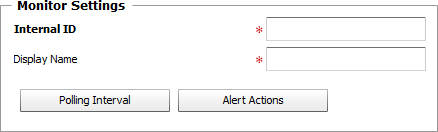
Nagios Plugins — Monitor Settings
| ▪ | Internal ID: Enter an ID to identify the monitored Nagios Performance Data instance in TrueSight Operations Management. |
| ▪ | Display Name: Enter a name to identify the monitored Nagios Performance Data instance in TrueSight Operations Management. |
| ▪ | Optional — Polling Interval: Set the frequency at which the data collection will be performed. Default is 2 minutes. |
| ▪ | Optional — Alert Actions: Define the action(s) Monitoring Studio needs to perform when the thresholds for this managed process instance is breached. |
 By default, alert actions apply to all Studio Nagios Performance Data monitor types under the Studio Nagios Plugin monitor type. By default, alert actions apply to all Studio Nagios Performance Data monitor types under the Studio Nagios Plugin monitor type.
To configure different alert actions for a specific Nagios Performance Data monitor type, you need to add a different Nagios Plugin and then specify the alert actions that will only apply to all its related Nagios Performance Data monitor types.
| 11. | Optional — Define the Content Processing rules you wish to apply to the command line output: |
Analyzing Command Lines — Content Processing Settings
| ▪ | String Searches: Define the search criteria for a specific string you wish to find or not find in the command line output. |
| 12. | Click the Add to List button to complete the creation of the Nagios Plugin instance. |
See Also
Studio Nagios Plugin
|


