|
The Windows Performance Counter Monitor is designed to monitor any commercial Windows-based technology or any custom technology relying on a Windows-based middleware which is instrumented through Windows Performance Counters.
The Windows Performance Counter Monitor collects information about elements on your Windows systems and measures them. These elements can be processors, threads, processes, memory, etc., with each one having an associate set of counters and possibly instances. The data gathered by the Windows performances about specific components can be used to identify problems and bottlenecks within your technology and plan ahead for your future needs.
The Windows Performance Counter Monitor brings Windows performance data, important to the proper functioning of your technology, within your BMC framework and automatically notifies you when a value breaches a specific threshold.
 This function is only available to agents running on Windows systems. This function is only available to agents running on Windows systems.
To monitor a Windows performance counter
| 1. | Access the Monitoring Studio Configuration panel, as explained in the Configure Monitors chapter. |
| 2. | In the Monitors section, click the Windows Perf Counters button. |
| 3. | The Windows Performance Counters panel is displayed to specify the performance counter to monitor. |
| 4. | Provide the Performance Counter Settings information for the Windows performance counter you wish to monitor: |
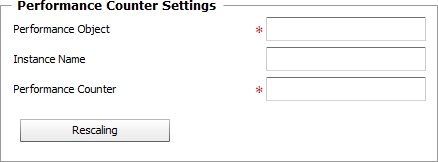
Windows Performance Counters — Settings
| ▪ | Performance Object: Enter the name of the Windows performance object that contains the counter you wish to monitor, for example: Win32_PerfRawData_PerfOS_Processor. |
| ▪ | Instance Name: Enter the name of the instance you wish to monitor. This name is used to distinguish between multiple performance objects of the same type on a single device, for example: 0. |
| ▪ | Performance Counter: Enter the name of the performance counter you wish to monitor, for example: PercentUserTime. |
Refer to our KB article to learn how you can easily get the list of Performance Objects and Performance Counters available for your system.
| 5. | Optional — Select a Rescaling option, if needed. A scale can be used to divide or multiply the Windows performance value by a specific number. |

Windows Performance Counters — Rescaling Settings
To do so, simply select the Divide by the Value Below or Multiply by the Value Below option and type in the number you wish the value to be divided/multiplied by. Leave this option set to No Rescaling (default) if you wish the solution to report on the performance counter raw value.
| 6. | Define the Monitor Settings: |
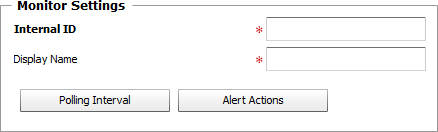
Windows Performance Counters — Monitor Settings
| ▪ | Internal ID: Enter an ID to identify the monitored performance counter in TrueSight Operations Management. |
| ▪ | Display Name: Enter a name to identify the monitored performance counter in TrueSight Operations Management. |
| ▪ | Optional — Polling Interval: Set the frequency at which the data collection will be performed. Default is 2 minutes. |
| ▪ | Optional — Alert Actions: Define the action(s) Monitoring Studio needs to perform when the thresholds for this managed performance counter instance is breached. |
| 7. | Click the Add to List button to complete the creation of the performance counter instance. |
| 

