Analyzing WMI Queries

Home  Previous  Next

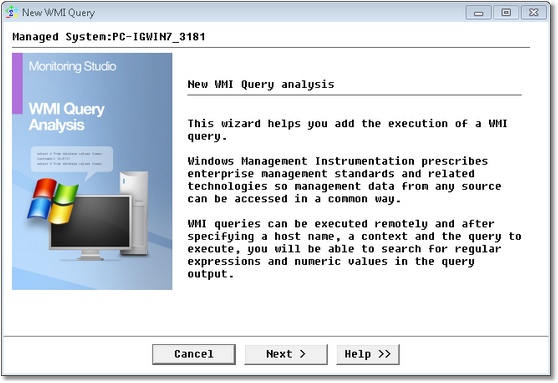
WMI (Windows Management Instrumentation) is the Microsoft implementation of WBEM (Web Based Enterprise Management) that provides users with information about the status of local or remote computer systems.

Monitoring Studio can execute WMI queries on your system and consolidate them within your PATROL environment along with the application monitoring under a single icon. It can also query the WMI repository for class and instance information. You can for example request the WMI that returns all the objects representing shut-down events from your desktop system.

WMI query analysis objects are instances of the SW_NT_WMI class.

Creating a WMI Query Analysis

1.In the PATROL Console, right-click the main Monitored Application icon > KM Commands > New > WMI Query analysis

WIZ_WMIQuery_1Welcome

WMI Query Analysis Wizard — Welcome Page

2.Click Next.

WIZ_WMIQuery_2Definition

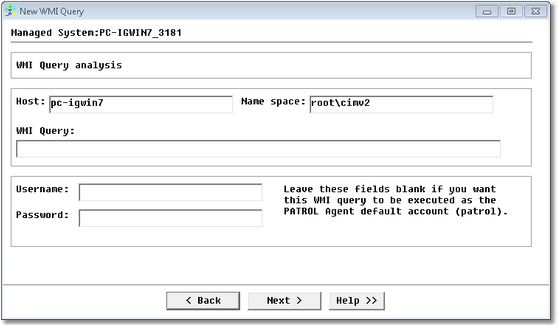
WMI Query Analysis Wizard — Definition Page

3.Identify the host:
Hostname: Enter the hostname or IP address.
Name space: Enter the WMI namespace. A namespace is a logical group of related classes representing a specific technology or area of management. Example: root\cimv2
WMI Query: Enter your query. Example: SELECT * FROM Win32 process. In case you need help to build your WMI query, you could download WMI CIM Studio, which is one of the WMI Administrative tools on the Microsoft site.
Username and Password: Enter your credentials. Leave these fields blank if you want the WMI query to be executed with the PATROL Agent default account (patrol).
4.Click Next.

WIZ_WMIQuery_3Settings

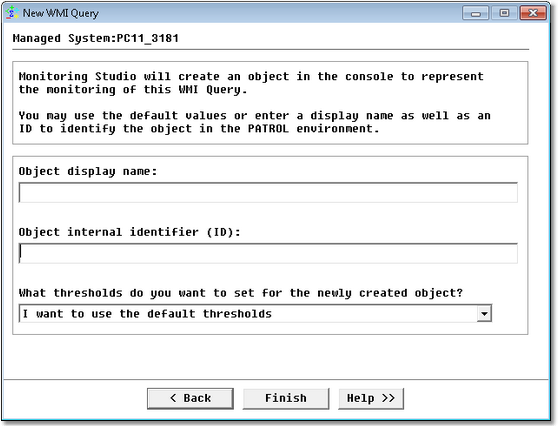
WMI Query Analysis Wizard — Settings Page

5.Configure the Monitoring Studio settings.
6.Click Finish. An icon representing the WMI query appears in the console with two parameters: ReturnOutput and QueryStatus under it. You can now run String Searches and Extract Numeric Values from this output.

See Also

About WMI

String Search

SW_NT_WMI

Text Pre-processing