|
This section details the various connection settings available for performing queries on a Microsoft SQL database server. First steps are common to all database queries and connection methods. They are described in the Analyzing a Database Query chapter.
Configuring a connection to a Microsoft SQL database server
| 1. | Define the Connection Settings to the Microsoft SQL database server: |
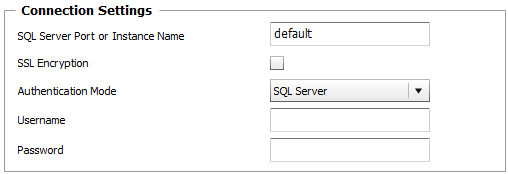
Microsoft SQL Database Server - Connection Settings
| ▪ | SQL Server Port or Instance Name: Enter the port to be used to access the Microsoft SQL database or specify the SQL server instance name if there are several SQL Server instances installed. Leave "default" if there is a single instance. |
| ▪ | (Deprecated) SSL Encryption: Since version 9.4.01 of Monitoring Studio, the SSL Encryption option is deprecated as it is handled automatically by the Microsoft's JDBC driver. |
| ▪ | (Deprecated) Authentication mode (SQL Server/Windows): Since version 9.4.01 of Monitoring Studio, the SQL Server Authentication option is deprecated as it is handled automatically by the Microsoft's JDBC driver. To use Windows-integrated Authentication, you need to specify new Credentials with empty username and empty password. In this case, the connection will be done using the PATROL Agent's default account. |
| ▪ | Username: Enter the username to use to connect to the database. Leave blank to use the username provided at the Host level. |
| ▪ | Password: Enter the password associated with the specified username. Leave blank to use the password provided at the Host level. |
 Connection Settings will be shared by all the queries defined within the Microsoft SQL Server Monitors. Connection Settings will be shared by all the queries defined within the Microsoft SQL Server Monitors.
| 2. | Define the SQL Query and Timeout properties: |
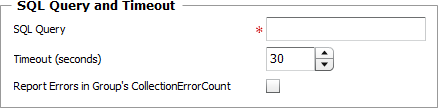
Microsoft SQL Database Server - Query and Timeout Settings
| ▪ | SQL Query: Enter the SQL query you wish to perform. |
| ▪ | Timeout (seconds): Specify the time in seconds after which the query will be stopped. (Default: 30 seconds). If the query times out, the Status attribute of the Studio Database Query Monitor Type will be set to 2 (Failed) and an alarm will be triggered in TrueSight Operations Management. |
| ▪ | Report Errors in Group's "CollectionErrorCount": Select this option to have the Collection Error Count attribute of the Group Monitor reflect possible alerts triggered upon the query execution. The Collection Error Count attribute of the Group reports on the collection errors of all Monitors, associated to the Group, for which this option is available and selected, providing a global view of the collection errors for the whole Group. |
| 3. | Define the Monitor Settings: |
| ▪ | Internal ID: Enter an ID to identify the managed SQL query instance in TrueSight Operations Management. |
| ▪ | Display Name: Enter a name to identify the managed SQL query instance in TrueSight Operations Management. |
| ▪ | Optional — Polling Interval: Set the frequency at which the data collection will be performed. Default is 2 minutes. |
| ▪ | Optional — Alert Actions: Define the action(s) Monitoring Studio needs to perform when the thresholds for this SQL query instance is breached. |
| 4. | Optional — Define the Content Processing rules you wish to apply to the SQL query output: |
| ▪ | String Searches: Define the search criteria for a specific string you wish to find or not find in the SQL query output. |
| 5. | Click the Add to List button to complete the creation of the SQL query instance. |
|


