JOnAs

Home  Previous  Next

JOnAS is a leading edge Open Source implementation by OW2 of the Java EE specification.

ImportantMonitoring Studio KM for PATROL requires application classes available only with JVM 1.5. Previous versions of JVM are not supported.

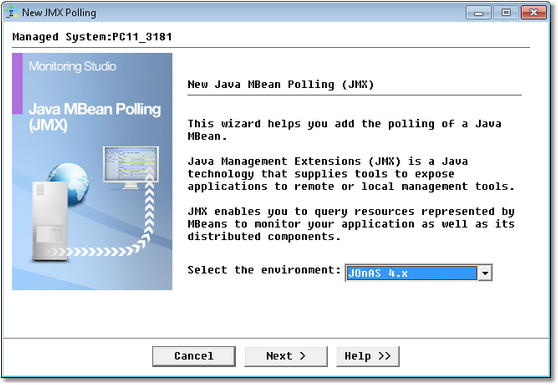
To monitor your JOnAs application server within your PATROL environment, right-click the Monitored Application icon > KM Commands > New > Java MBean polling (JMX). From the drop-down list, select the environment.

WIZ_JavaMBeanPolling_1JonasWelcome

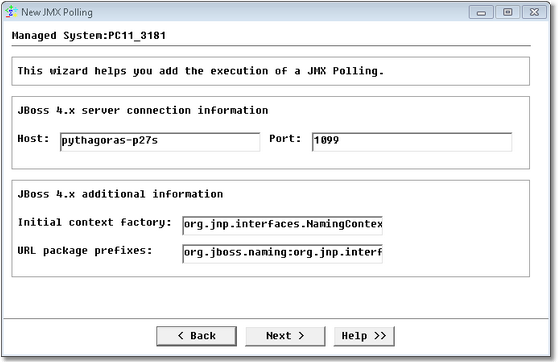
Java MBean Polling Wizard (JOnAs Environment) — Welcome Page

Step 1: Enter the server connection information and the additional information

WIZ_JavaMBeanPolling_2JonasConnectionInfo

Java MBean Polling Wizard (JOnAs Environment) — Connection Information Page

Host: Name of host server where the JOnAS application server is installed
Port: Port number. (By default: 1091). This is linked to the protocol used. Can be modified
Server name: Name given to Jonas application server
Protocol: JRMP or IIOP. The protocol & the port number to be used is defined in the "carol.properties" file that can be found in %jonas_home%/conf
Initial context factory: com.sun.jndi.rmi.registry.RegistryContextFactory (by default). Can be modified
URL package prefixes: org.objectweb.jonas.naming (by default). Can be modified.

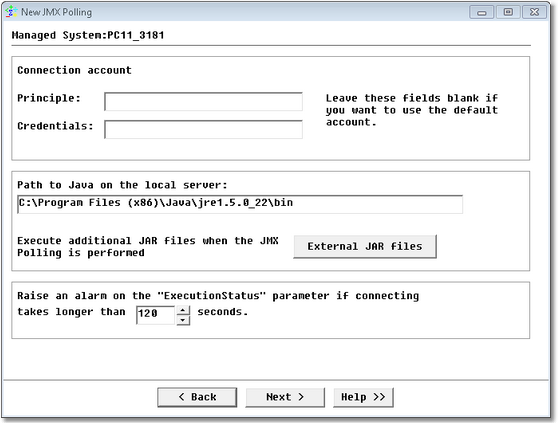
Step 2: Enter the connection account credentials

WIZ_JavaMBeanPolling_3JonasCredentials

Java MBean Polling Wizard (JOnAs Environment)  — Connection Account Credentials Page

Principle: Enter the username
Credentials: Enter the password
Path to Java on the local server: Enter your java bin path and ensure that all the settings are correct.
Connection timeout period: Default is set to 120 seconds; you can change this if you wish. When this timeout is reached, Monitor Studio considers the host to be unreachable and triggers an alert on the ExecutionStatus parameter.

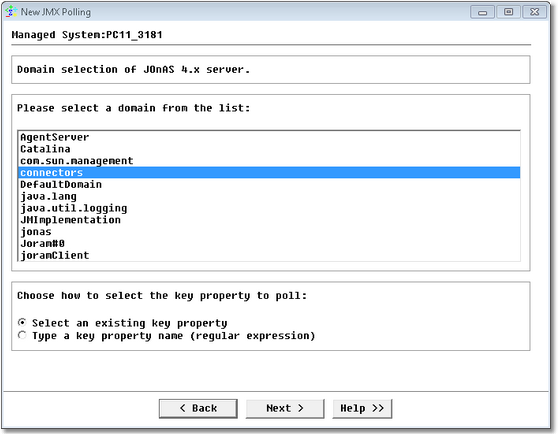
Click Next. If the credentials entered are correct, Monitoring Studio connects to the application server and presents a list of domains for you to select from.

Step 3: Select the domain

WIZ_JavaMBeanPolling_4JonasDomain

Java MBean Polling Wizard (JOnAs Environment)  — Domain Selection Page

1.Select the domain to monitor
2.Choose the key property selection mode. You can either choose to select a key property among a list of existing ones or type a regular expression for the key property name.
3.Click Next.

Step 4: Specify the key property

Depending on the option selected at the previous step, you will either have to select a key property among a list of existing ones or type a key property name (regular expression).

Step 5: Select the attribute

WIZ_JavaMBeanPolling_6JonasAttribute

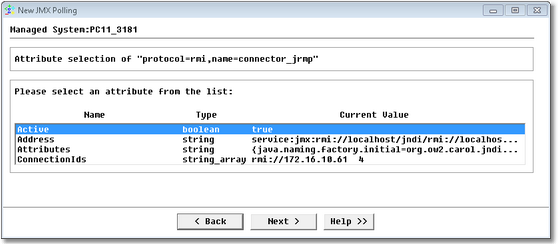
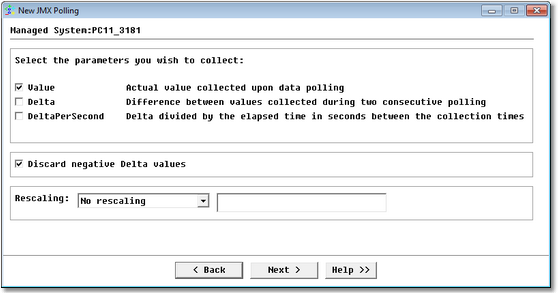
Java MBean Polling Wizard (JOnAs Environment)  — Attribute Selection Page

Select the attribute from the list and click Next.

You can only select one attribute at a time. To monitor several attributes of the same key property, you are required to go through the wizard each time.

Step 5a: Select parameters to collect

When you select a numeric attribute (boolean, integer, number) at the previous step, an additional panel is displayed to allow you to select the parameters to collect.

WIZ_NumericValue_6Param

Java MBean Polling Wizard (JOnAS Environment)  — Parameters Selection Page

Value: Reports the actual value collected upon data polling
Delta: Calculates the difference between values collected during two consecutive polling.
DeltaPerSecond: Reports the value resulting of the division of the Delta by the number of seconds elapsed between the collection times
Select the option Discard negative Delta values if you do not want negative values to be reported on the graph.
Use the Rescaling option to configure Monitoring Studio to rescale the value that is being extracted in order to have a more readable graph in the PATROL Console. The available rescaling options are:
No rescaling
Divide the value by a value that then gives you the reading in terms best suited to you
Multiply the extracted value by a constant factor
This can be useful if you extract numeric values in bytes but prefer to show a graph in megabytes. In such a case, you would divide the values by 1048576 (1024*1024).

Step 6: Monitoring Studio settings

You arrive at the final step of the wizard that displays the object display name, ID and threshold options. For more information, refer to the section Configuring the Monitoring Studio Settings.

Click Finish. An icon for the monitored instance will appear under the main Monitoring Studio icon bearing the name entered/displayed in the Object display name field; and at the next collect you will see values for the newly monitored object.

You can add a string or numeric value search if you wish.

JOnAS client objects are instances of the SW_JMX class.


See Also

Java MBean Polling (JMX)

JBoss

Numeric Value extraction

String Search

SW_JMX

WebLogic

WebSphere