|
IBM® WebSphere Application Server is the foundation of the IBM WebSphere software platform, and a key building block for a Service Oriented Architecture (SOA). As the premier Java™ 2 Enterprise Edition (J2EE™) and Web services application platform, WebSphere Application Server delivers a high performance transaction engine that can help you build, run, integrate and manage dynamic On Demand Business™ applications.
 Before setting-up the monitoring of a WebSphere AS, you need to download the WebSphere.jar files created to work with Monitoring Studio from the Sentry Software's Website and store them in (%PATROL_Home%\bin). These files are essential in order to connect to your WebSphere AS through Monitoring Studio. They can be downloaded from the Sentry Software website. Before setting-up the monitoring of a WebSphere AS, you need to download the WebSphere.jar files created to work with Monitoring Studio from the Sentry Software's Website and store them in (%PATROL_Home%\bin). These files are essential in order to connect to your WebSphere AS through Monitoring Studio. They can be downloaded from the Sentry Software website.
To monitor a WebSphere application server within your PATROL environment:
| 1. | After ensuring that the required files are present on the local host |
| 2. | In the PATROL Console, right-click the Monitored Application icon > KM Commands > New > Java MBean polling (JMX) |
| 3. | From the drop-down list, select the environment. |
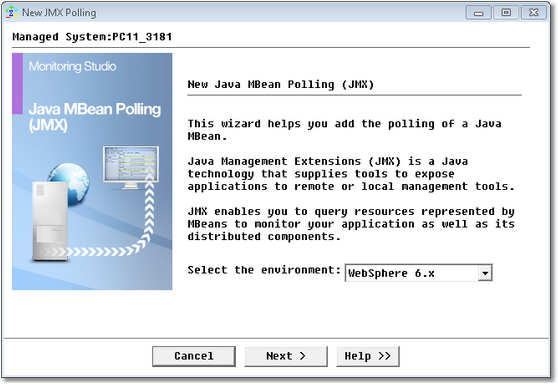
Java MBean Polling Wizard (WebSphere Environment) — Welcome Page
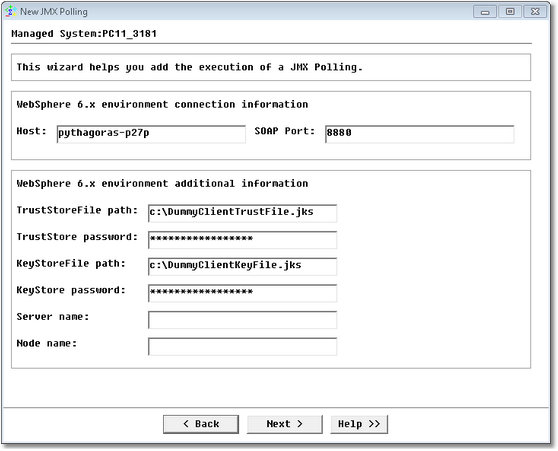
Java MBean Polling Wizard (WebSphere Environment) — Connection Information Page
| • | Host: Name of host server where the WebSphere application server is installed |
| • | SOAP Port: Enter port number. The first profile created on WebSphere is by default given the number 8880 and every profile created on WebSphere is allotted a new SOAP port number by increasing the count from 8880. This can be modified. |
To connect to the WebSphere AS, it is essential to connect to certain credential files: ClientKeyFile.jks and ClientTrustFile.jks.
These files are profile-specific and are created and stored by WebSphere under %IBM_HOME%\profile\profilename\etc.
Depending on the security of your environment, you can either give the path to these files on where the WebSphere AS resides, or, just copy them from there to your local file-system.
| • | TrustStoreFile path: Enter the path to the file ClientTrustFile.jks. |
| • | TrustStore password: Enter the password created on WebSphere for your profile (default WebAS) |
| • | KeyStoreFile path: Enter the path to the file ClientKeyFile.jks |
| • | KeyStore password: Enter the password created on WebSphere for your profile (default WebAS) |
| • | Server name: Name of the WebSphere application server. |
| • | Node name: Enter the node name allotted to your profile. By default WebSphere assigns a unique node name to each profile created. |
Click Next.
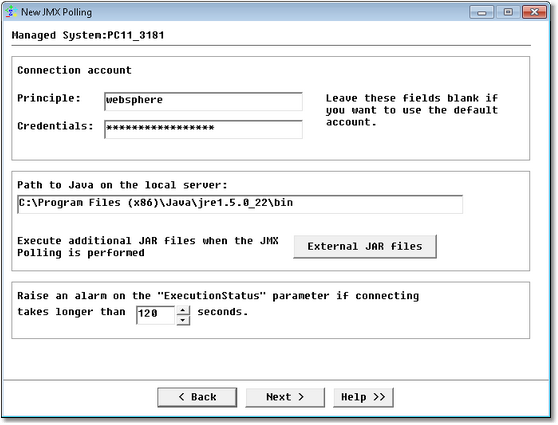
Java MBean Polling Wizard (WebSphere Environment) — Connection Account Credentials Page
| • | Principle: Enter the username |
| • | Credentials: Enter the password |
| • | Path to Java on the local server: Enter your java bin path and ensure that all the settings are correct. |
| • | Connection timeout period: Default is set to 120 seconds; you can change this if you wish. When this timeout is reached, Monitor Studio considers the host to be unreachable and triggers an alert on the ExecutionStatus parameter. |
Click Next. Ensure that all the settings are correct. If the credentials entered are correct, Monitoring Studio connects to the application server and presents a list of domains for you to select from.
Step 3: Select the domain
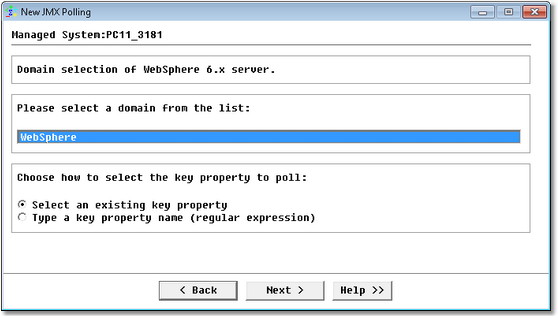
Java MBean Polling Wizard (WebSphere Environment) — Domain Selection Page
| 1. | Select the domain to monitor |
| 2. | Choose the key property selection mode. You can either choose to select a key property among a list of existing ones or type a regular expression for the key property name. |
Step 4: Specify the key property
Depending on the option selected at the previous step, you will either have to select a key property among a list of existing ones or type a key property name (regular expression).
Step 5: Select the attribute
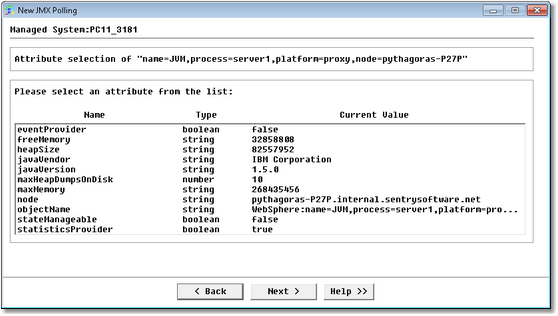
Java MBean Polling Wizard (WebSphere Environment) — Attribute Selection Page
Select the attribute from the list and click Next.
You can only select one attribute at a time. To monitor several attributes of the same key property, you are required to go through the wizard each time.
Step 5a: Select parameters to collect
When you select a numeric attribute (boolean, integer, number) at the previous step, an additional panel is displayed to allow you to select the parameters to collect.
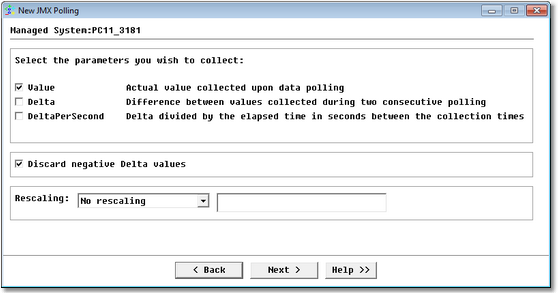
Java MBean Polling Wizard (WebSphere Environment) — Parameters Selection Page
| ▪ | Value: Reports the actual value collected upon data polling |
| ▪ | Delta: Calculates the difference between values collected during two consecutive polling. |
| ▪ | DeltaPerSecond: Reports the value resulting of the division of the Delta by the number of seconds elapsed between the collection times |
| • | Select the option Discard negative Delta values if you do not want negative values to be reported on the graph. |
| • | Use the Rescaling option to configure Monitoring Studio to rescale the value that is being extracted in order to have a more readable graph in the PATROL Console. The available rescaling options are: |
| ▪ | Divide the value by a value that then gives you the reading in terms best suited to you |
| ▪ | Multiply the extracted value by a constant factor |
| This can be useful if you extract numeric values in bytes but prefer to show a graph in megabytes. In such a case, you would divide the values by 1048576 (1024*1024). |
Step 6: Monitoring Studio settings
You arrive at the final step of the wizard that displays the object display name, ID and threshold options. For more information, refer to the section Configuring the Monitoring Studio Settings.
Click Finish. An icon for the monitored instance will appear under the main Monitoring Studio icon bearing the name entered/displayed in the Object display name field; and at the next collect you will see values for the newly monitored object. You can add a string or numeric value search if you wish.
WebSphere objects are instances of the SW_JMX class.
See Also
Java MBean Polling (JMX)
JBoss
JOnAS
Numeric Value extraction
String Search
SW_JMX
WebLogic
| 

