|
Successfully measuring and monitoring the Web farms overall availability can be challenging if not relying on the Web-farm monitoring tool provided by Monitoring Studio. This tool helps you ensure the availability of your Web farms by indicating how many servers are responding with the correct Web content. It essentially groups HTTP requests all together, allowing you to use all the tools of the SW_HTTP_REQUESTS class to monitor your Web-farms.
Creating a Web Farm Monitoring
| 1. | In the PATROL Console, right-click the Monitored Application icon and select KM Commands > New > Web-farm monitoring… |
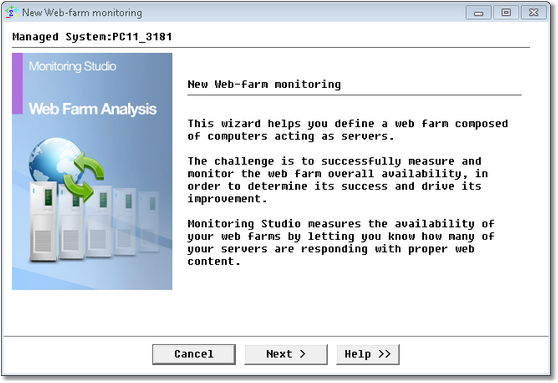
Web-Farm Monitoring Wizard — Welcome Page
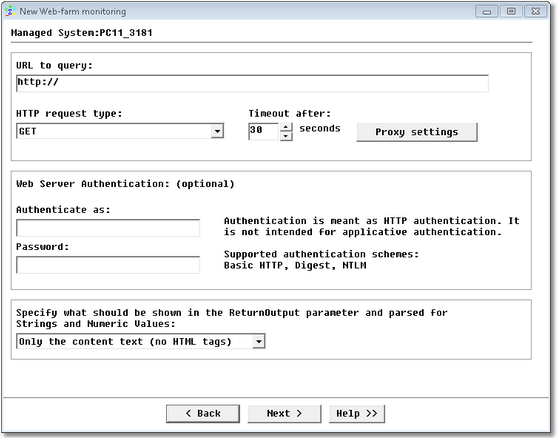
Web Request Analysis Wizard — Definition Page
| 3. | Configure your Web-farm monitoring: |
| ▪ | URL to query: Enter the URL of the Web site that needs to be monitored. From a Windows agent, it is possible to poll a secure Web site by using the "https" method. |
| ▪ | HTTP Request type: Enter the HTTP request. There are two different modes: "GET" and "POST". |
| ▪ | The "GET" mode (HTTP GET method) is the standard way to query a Web page from a Web server. |
| ▪ | The "POST" mode (HTTP POST method) is classically used to post a form to a Web server and obtain the result of the processing of the form data. If you choose this mode, you must specify the variables and values to be transmitted to the Web server. Please note that: |
| ▪ | Some Web forms can be passed to the server with the HTTP GET method. In such case, the form data is passed through the URL (http://server/form.php?varA=valueA&varB=valueB&…). You must check the Web form HTML source to know which method needs to be used (GET or POST). |
| ▪ | When posting a form to a Web server, you have to enter the URL of the script/CGI/page that will actually process the data, which may be different from the Web page URL that shows the form itself. Again, you need to check the Web form HTML source to identify the URL to query. |
| ▪ | A Web form HTML source should contain a statement like the following one: <FORM METHOD="POST" ACTION="/urlToQuery.php"> |
| ▪ | Timeout after: Enter the connection timeout period (By default: 30 seconds). When this timeout is reached, Monitoring Studio considers the host to be unreachable and triggers an alert on the ServerConnectionState parameter. |
| ▪ | Proxy settings (optional): If your environment uses a proxy server, click to enter the proxy settings required to execute the HTTP request. |
| ▪ | Authenticate as: Enter the user name as required by the HTTP server |
| ▪ | Password: Enter the password. |
| ▪ | Specify what should be shown in the ReturnOutput parameter: Select what you would like to retrieve from the Web page returned by the Web server: the entire HTTP response; only the Web page (with HTML tags) or only the content text (no HTML tags). |
| 4. | If you previously selected the "GET" method, enter the host information. Since a web-farm is composed of several servers, you can enter up to 10 hosts that make-up the web-farm: |
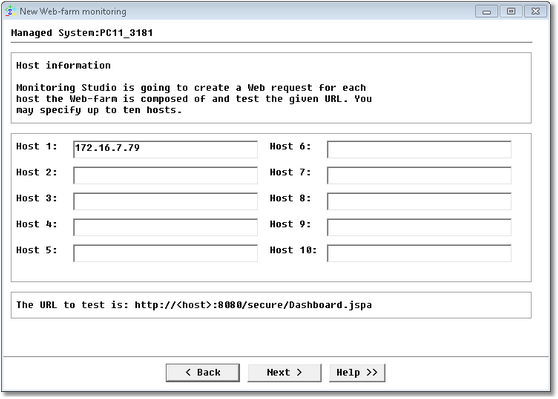
Web Request Analysis Wizard — GET Method Information Page
| 5. | If you previously selected the "POST" method, the following dialog box is displayed: |
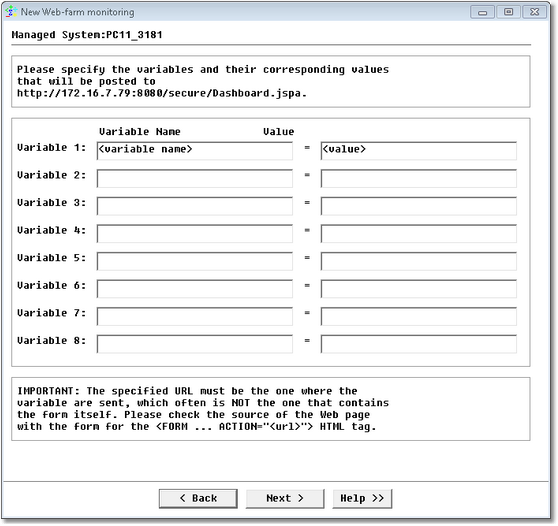
Web Request Analysis Wizard — POST Variables Definition Page
| ▪ | Enter the variable(s) name and value |
| ▪ | Enter the host information |
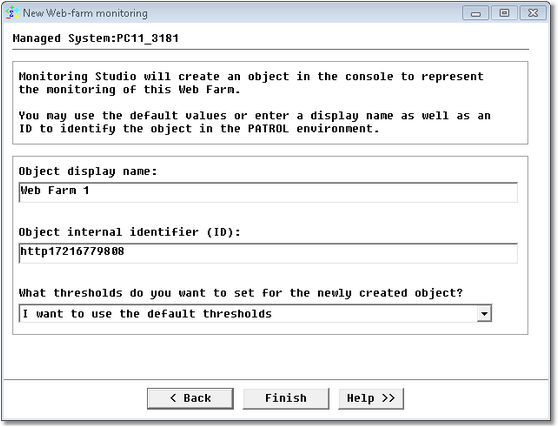
Web Request Analysis Wizard — Settings Page
 You cannot edit the webfarm instance but you can edit individual hosts (web–requests) under this web farm. You can add, edit and delete the hosts grouped under the webfarm icon at any time. To add a host, right-click the web farm icon > KM commands > Add host. To edit or delete a host, right-click the host icon > KM commands > Edit host or Delete as the case may be.. You cannot edit the webfarm instance but you can edit individual hosts (web–requests) under this web farm. You can add, edit and delete the hosts grouped under the webfarm icon at any time. To add a host, right-click the web farm icon > KM commands > Add host. To edit or delete a host, right-click the host icon > KM commands > Edit host or Delete as the case may be..
See Also
Numeric Value extraction
String Search
SW_HTTP_REQUEST
SW_HTTP_WEBFARM
Text Pre-processing
|


