BMC Helix Exporter
Connect OpenTelemetry Pipelines to BMC Helix
Seamlessly stream metrics from any OpenTelemetry source, whether OTel receivers, Prometheus exporters, MetricsHub®, or instrumented applications, into BMC Helix and turn telemetry into clear, actionable insights.
Request a Demo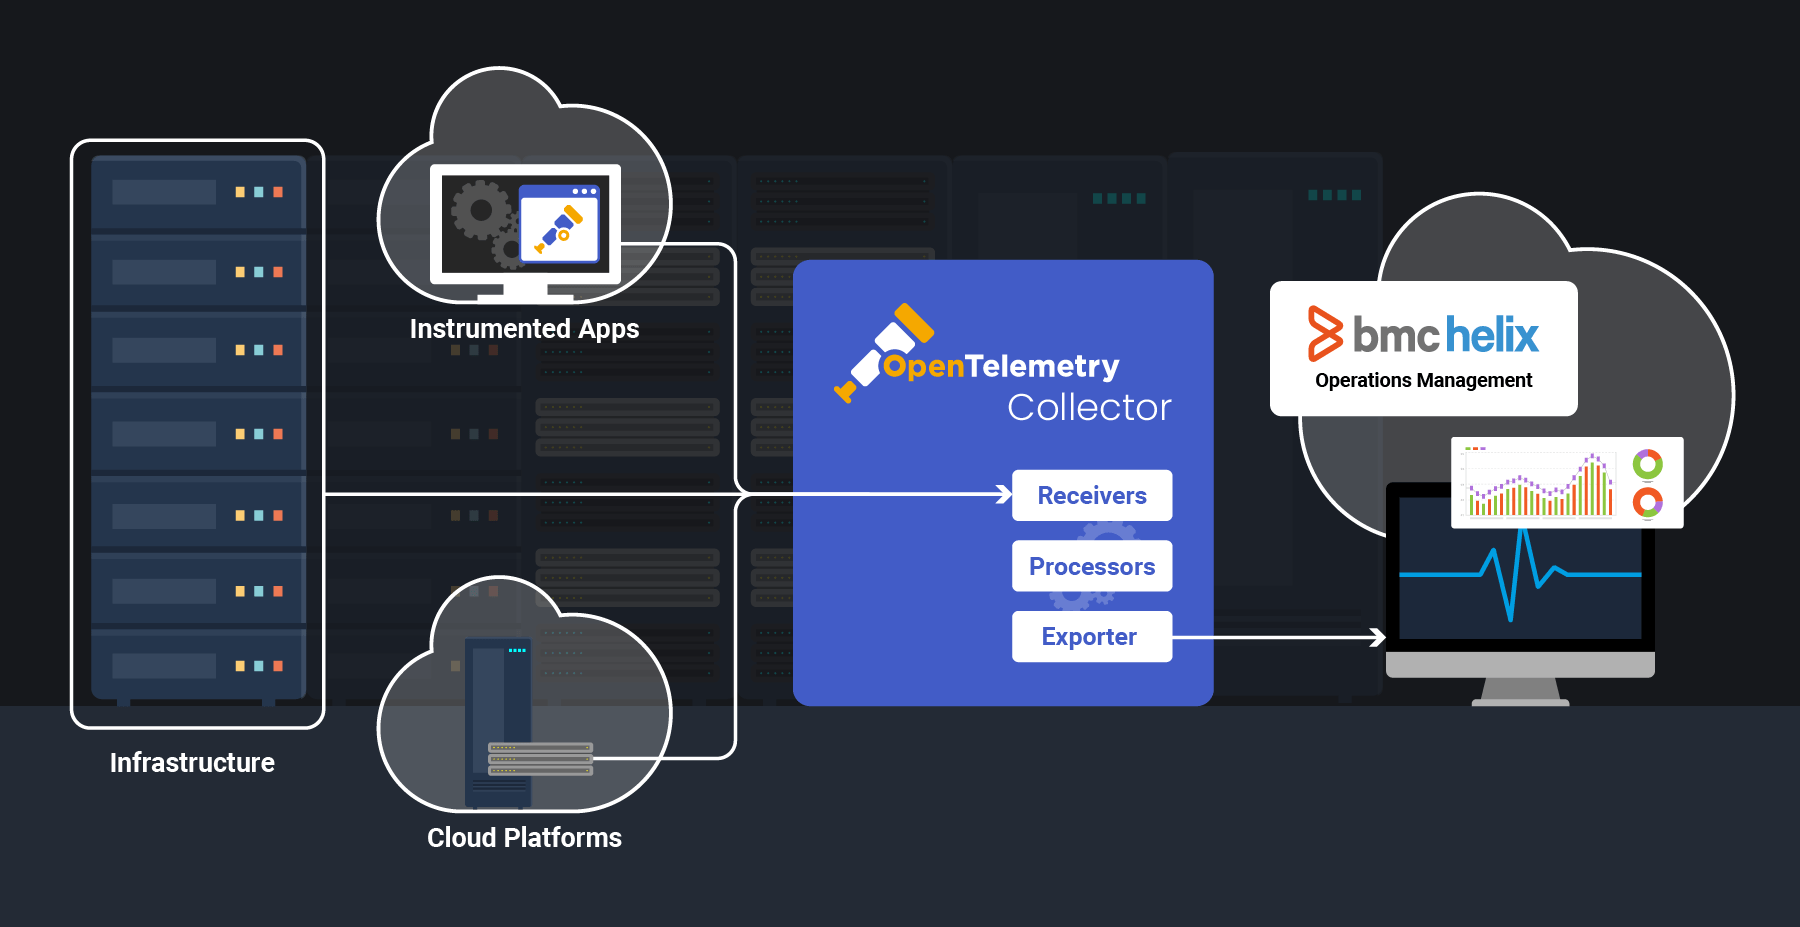
Too Much Data. Too Little Insight.
Modern IT environments generate an overwhelming stream of telemetry (metrics, logs, and traces) coming from applications, infrastructure, and cloud platforms, each with its own format and complexity. Left unmanaged, this flood drives up costs, fragments information into silos, and buries critical insights.
Why BMC Helix Exporter?
Go Beyond OpenTelemetry with BMC Helix
Unlock enterprise-grade capabilities you won't get with OpenTelemetry alone

- Use AI/ML to cut alert noise, minimize downtime, and surface issues before they escalate.
- Leverage HelixGPT for context-aware recommendations, natural-language Q&A, instant summaries, and automated resolution suggestions.
- Enrich OTel signals with contextual information about services and applications with BMC Helix Discovery and make sense of your raw OTel metrics.
Fuel Helix AIOps and HelixGPT with OTel Metrics
Extend your BMC Helix environment with the power of OpenTelemetry

- Leverage the full OTel ecosystem: Centralize telemetry from any receiver, exporter, or instrumented application into BMC Helix.
- No custom integrations or re-instrumentation required: OpenTelemetry flows naturally into BMC Helix.
How OpenTelemetry Integrates with BMC Helix
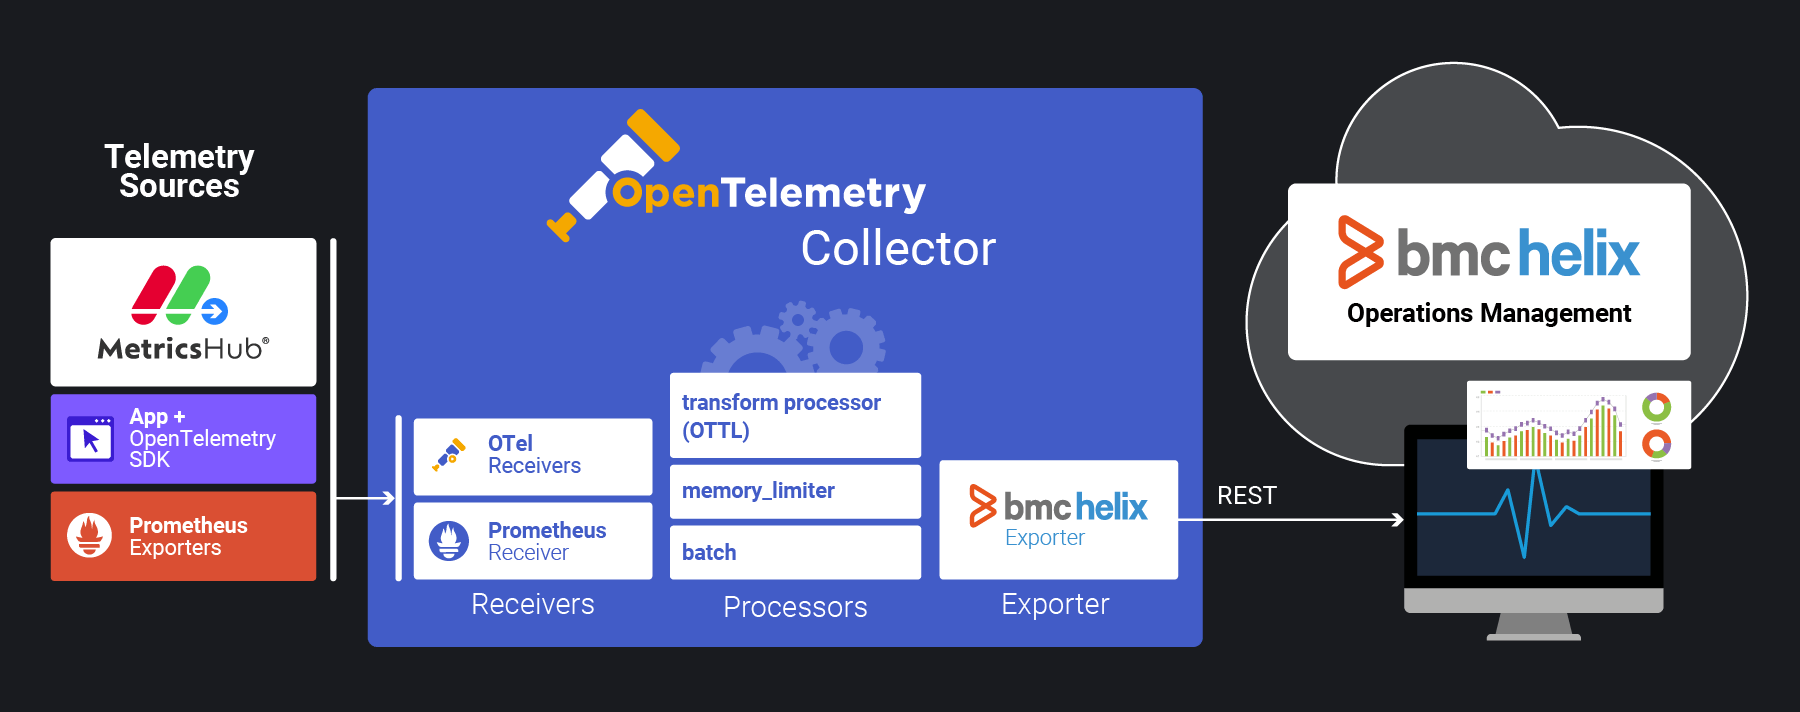
The BMC Helix Exporter extends the OpenTelemetry Collector and acts as a bridge between telemetry sources (e.g., MetricsHub, Prometheus exporters, or any application instrumented with OpenTelemetry) and BMC Helix Operations Management. It normalizes and enriches data as needed, then delivers it to BMC Helix via REST API.
Effortless Integration in Just a Few Steps
Read the docs-
1
Install the latest version of OpenTelemetry Collector.
-
2
Enable and configure the BMC Helix Exporter.
-
3
Enrich the metrics with the required BMC Helix attributes.
Real-World Examples

Bringing Local Systems Metrics to BMC Helix
The customer lacked visibility into local system performance (CPU usage, disk I/O, file system activity, and memory consumption) and needed a simple way to send system-level metrics into BMC Helix.
They installed the latest version of the OpenTelemetry Collector Contrib, configured the Host Metrics receiver and the BMC Helix Exporter to send data to their BMC Helix platform.
The customer instantly gained real-time insight into their local system health, enabling faster troubleshooting and proactive performance monitoring.
With hundreds of receivers available, you can support almost any use case, from Java applications and Prometheus endpoints to log ingestion and cloud platforms.Explore Existing Receivers

Routing Nginx Metrics to BMC Helix
The customer struggled to troubleshoot Nginx issues due to limited visibility into request rates, response code counts, and performance bottlenecks.
They deployed the Nginx Prometheus exporter, enabled the Prometheus Receiver, and routed the metrics to BMC Helix through the BMC Helix Exporter.
This provided clear, actionable insights into Nginx traffic, errors, and latency, significantly improving their ability to diagnose and resolve performance issues.
With a wide range of Prometheus exporters available, you can support virtually any monitoring use case, from databases and message queues to network devices and cloud services.Explore Existing Prometheus Exporters

Capturing Application-Level Metrics in BMC Helix
The customer lacked visibility into how their in-house applications were performing.
They instrumented their applications with OpenTelemetry SDKs and configured the BMC Helix Exporter to send application-level metrics, such as request latency, error rates, and throughput, directly into BMC Helix.
This gave them full visibility into their application performance alongside IT infrastructure.
Any OTel-instrumented app can send telemetry to BMC Helix, whether it's databases, web services, or custom business applications.Instrument Your Apps with OpenTelemetry

Streaming Infrastructure Health and Performance Metrics into BMC Helix
The customer relied on multiple tools to monitor their servers, storage systems, and network devices, resulting in fragmented and incomplete insights.
Using MetricsHub Enterprise, they consolidated hardware telemetry across their heterogenous infrastructure and forwarded it to BMC Helix through the BMC Helix Exporter.
Adopting BMC Helix and MetricsHub allowed them to replace their siloed monitoring setup with a single, real-time view of their IT infrastructure.
All Sentry customers with BMC Helix Operations Management bundles are entitled to MetricsHub Enterprise at no additional cost, replacing traditional PATROL KMs.Explore MetricsHub Read docs

Securing Telemetry in Air-Gapped Environments
One customer used an OpenTelemetry pipeline to monitor Windows servers in a highly secured site with no external connectivity. Metrics were collected locally with Monitoring Studio X, Windows KM, and PATROL Agents, then exported as files by the OpenTelemetry Collector. These files were transferred through a data diode to a central location, where the BMC Helix Exporter forwarded them into BMC Helix Operations Management.
MetricsHub and the BMC Helix Exporter enabled secure, end-to-end monitoring of isolated, mission-critical systems without compromising the site's strict security requirements.
OpenTelemetry pipelines make it possible to monitor critical infrastructure in air-gapped environments, ensuring visibility without exposing sensitive systems.Explore MetricsHub
The Team Behind the BMC Helix Exporter
The Sentry Software team contributed the BMC Helix Exporter to the OpenTelemetry Collector Contrib project, leveraging deep expertise in the BMC Helix ecosystem to deliver a seamless out-of-the-box integration.
To ensure accuracy, the team carried out extensive metric mapping work (converting ratios into percentages, counters into rates, and more) so that data is standardized and immediately usable.
As a long-standing BMC partner, Sentry Software is fully committed to maintaining and evolving the BMC Helix Exporter, ensuring its reliability and long-term value for the observability community.
BMC Helix Exporter GitHub RepoAdditional Resources
Webinar - From Legacy to Leading Edge: Leveraging OpenTelemetry Metrics with BMC Helix AIOps (1:00:39)
MetricsHub Blog
A Journey into OpenTelemetry: Building the BMC Helix Exporter
Discover how a simple idea grew into a powerful OpenTelemetry Collector component that connects observability pipelines to BMC Helix Operations Management.
Read the Blog