MetricsHub
The Next-Gen Metrics Collector for BMC Helix
Built on OpenTelemetry, MetricsHub® delivers unified, vendor-neutral telemetry to BMC Helix and expands your monitoring capabilities far beyond traditional use cases.
Unify visibility across servers, networks, storage, databases, and applications, while preparing your Helix environment for the future of monitoring.
Modernize. Unify. Observe.
Request a Demo
Prepare for the Future of Monitoring
Modern monitoring is accelerating toward OpenTelemetry, unified telemetry pipelines, and AIOps-driven operations. To keep pace, you need a way to modernize without starting over. This raises a critical question: how do you extend your BMC Helix environment and adopt open standards smoothly?
Why MetricsHub?
Modernize Without Starting Over

- Reuse your existing license: Move from Sentry KMs to MetricsHub at no additional cost
- Bring OpenTelemetry to BMC Helix: MetricsHub extends your environment with unified telemetry
- Embrace modernity without losing legacy: MetricsHub builds on Sentry Software's deep expertise in hardware and storage monitoring.
Simplify with MetricsHub

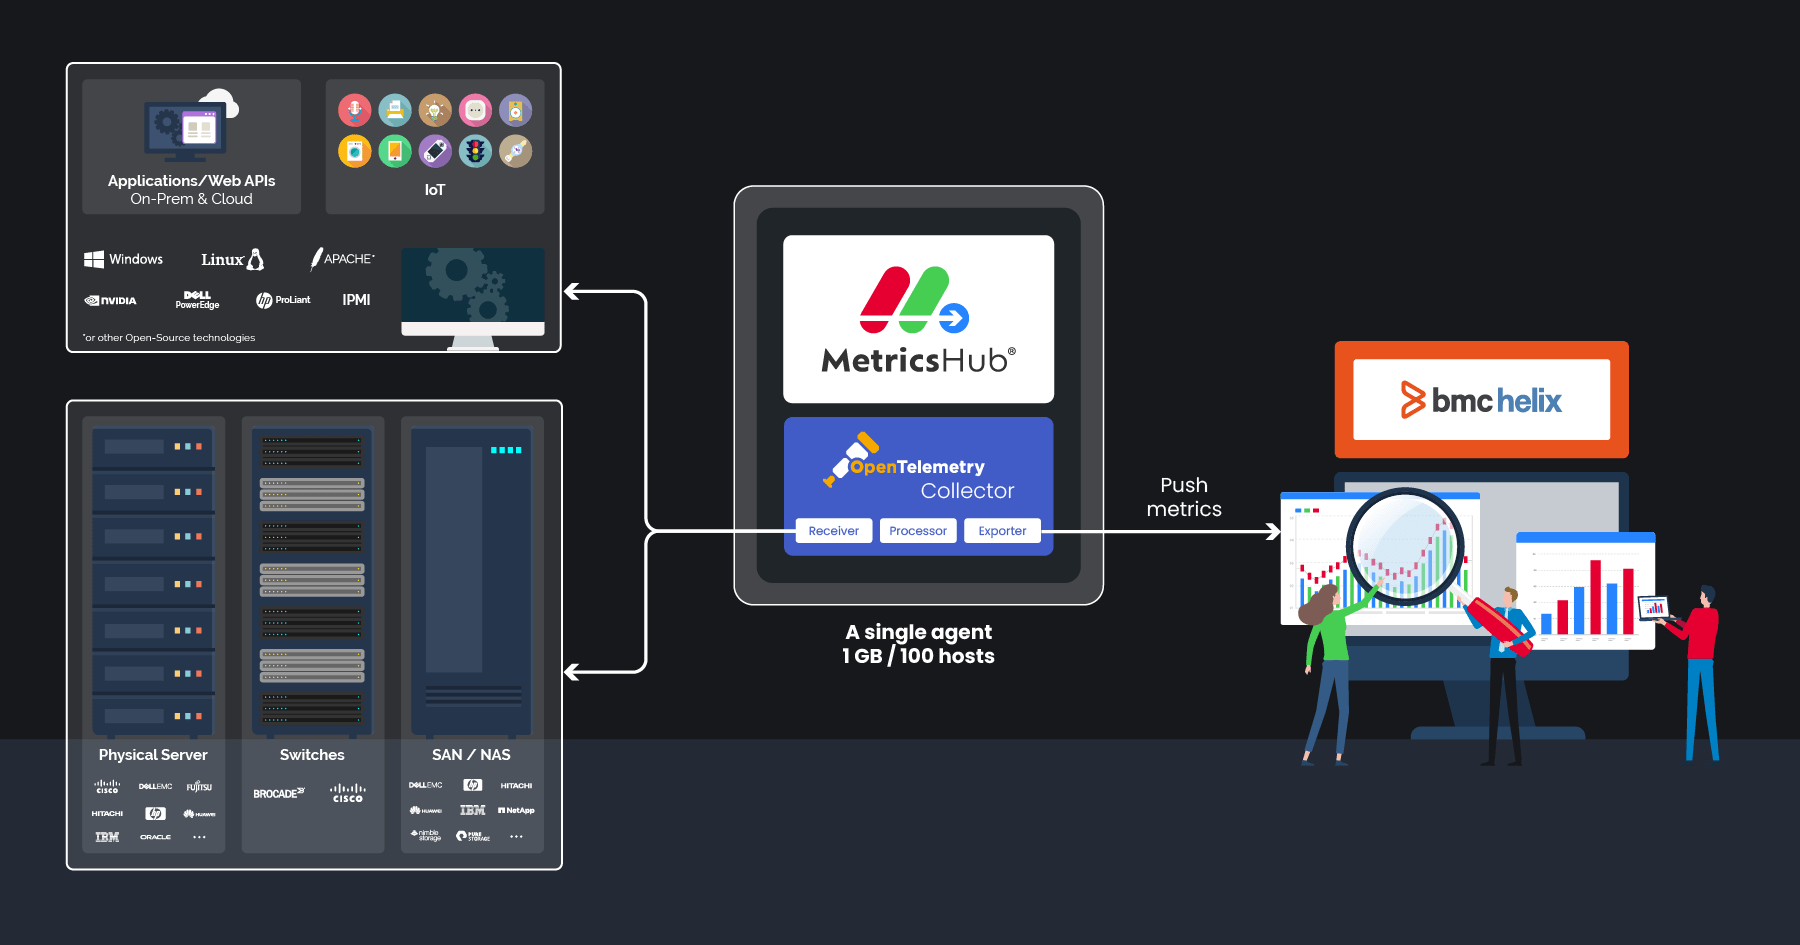
- Deploy faster: A single MetricsHub Agent can monitor up to 1,000 remote systems, making deployment dramatically simpler and faster than traditional agent-based solutions.
- Leverage open standards: Use standard OpenTelemetry metrics for effortless querying, dashboarding, and alerting.
- Unify infrastructure observability: Gain consistent visibility across servers, networks, storage, databases, and applications from one collector.

All customers of the Sentry Bundle for BMC Helix Operations Management are entitled to MetricsHub Enterprise at no additional cost.
How MetricsHub Works
MetricsHub collects detailed health and performance metrics across your infrastructure, covering servers, storage systems, databases, and network devices, and pushes them to BMC Helix through the BMC Helix Exporter.
Key Features
Scalable Remote Monitoring
Monitor up to 1,000 systems from a single MetricsHub instance. Eliminate manual setup with fully automated provisioning and programmable configuration.
System Performance Monitoring
Track CPU, memory, filesystem, disk, and network performance on Linux and Windows to detect bottlenecks early and maintain smooth operations.
Hardware monitoring
Detect and predict failures in processors, memory modules, disks, network cards, controllers, power supplies, fans, temperature sensors, and more.
Storage Monitoring
Monitor health, capacity, and performance across disks, volumes, and controllers. Track I/O, latency, usage, endurance, and environmental data.
Database Monitoring
Observe query latency, I/O performance, cache efficiency, connection counts, memory usage, and error rates to optimize responsiveness.
Sustainability Insights
Track electricity usage and CO₂ emissions across your IT infrastructure. Optimize data center temperature to cut energy costs and reduce your environmental footprint.
Extensible Monitoring
Collect custom metrics through standard protocols (SNMP, SSH, WBEM, WMI, and more) to easily extend coverage to your specific cases.
AI Enabler
Connect any LLM to real-time infrastructure metrics through the MetricsHub MCP Server to assist administrators in problem resolution.

Effortless Integration in Just a Few Steps
Read the Integration Guide-
1
Install MetricsHub: Fast setup with installable packages for RedHat, Docker, and Windows.
-
2
Configure Resource Monitoring: Comprehensive coverage of servers, storage, networks, databases, and services.
-
3
Configure Integration: create an authentication key, configure the BMC Helix Exporter, and transform metrics.