Use cases
This section describes the following HP 3PAR monitoring use cases:
- Storage Capacity Monitoring and Optimization
- Performance Optimization
- Traffic Management
Storage Capacity Monitoring and Optimization
Making sure that a storage system has enough remaining disk space available is critical for several reasons:
- SAN administrators want to make sure to be able to provision disk space for new servers when requested, as quickly as possible.
- The storage system itself may need additional disk space for specific features to work properly, like automatic snapshots, mirroring, etc.
- If thin provisioning is used, the remaining disk space becomes dramatically critical since the inability to allocate additional space to a volume when requested by the subscriber host will lead to catastrophic data loss and corruption.
Reporting on Disk Space Consumption
For a granular view of the disk space usage in the disk array, analyze the attributes of the HP 3PAR Storage Pool monitor type:
- The Subscribed Capacity attribute represents the amount of disk space that has been made available to the subscriber hosts, or in other words, the amount of disk space that is seen by the servers connected to the storage system.
- The Consumed Capacity attribute represents the actual space usage in the storage pool. For “thin” pools (when thin provisioning is enabled on the storage system), this value is normally lower than the Subscribed Capacity, as it is the main purpose of thin provisioning. For traditional pools, the Consumed Capacity attribute has the same value as the Subscribed Capacity attribute, as the entirety of the subscribed disk space is fully allocated in the storage pool.
- The Consumed Capacity Percentage attribute is the most critical one, even for non-thin storage pools, as a storage pool usage nearing 100% means that SAN administrators will not be able to create new volumes in the storage pool. By default, no alarm or warning threshold is set on this parameter as the fullness of a storage pool may be a normal situation.
To verify the available disk space in several storage pools:
- Log on to the TrueSight console
- Select Dashboards from the navigation pane
- In the Dashboards page, click Add Dashboard or select Add Dashboard from the dashboard action menu

- Enter a Title for your dashboard and configure a Global Filter, if needed
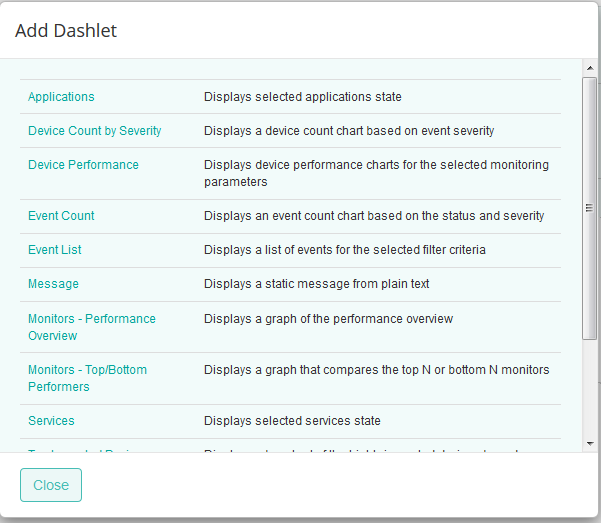
- Click Add Dashlet to open the dashlet library for the first column of the row
- From the dashlet library, select the Device Performance template, and then click Close
-
Select Configure Dashlet by clicking the
 button
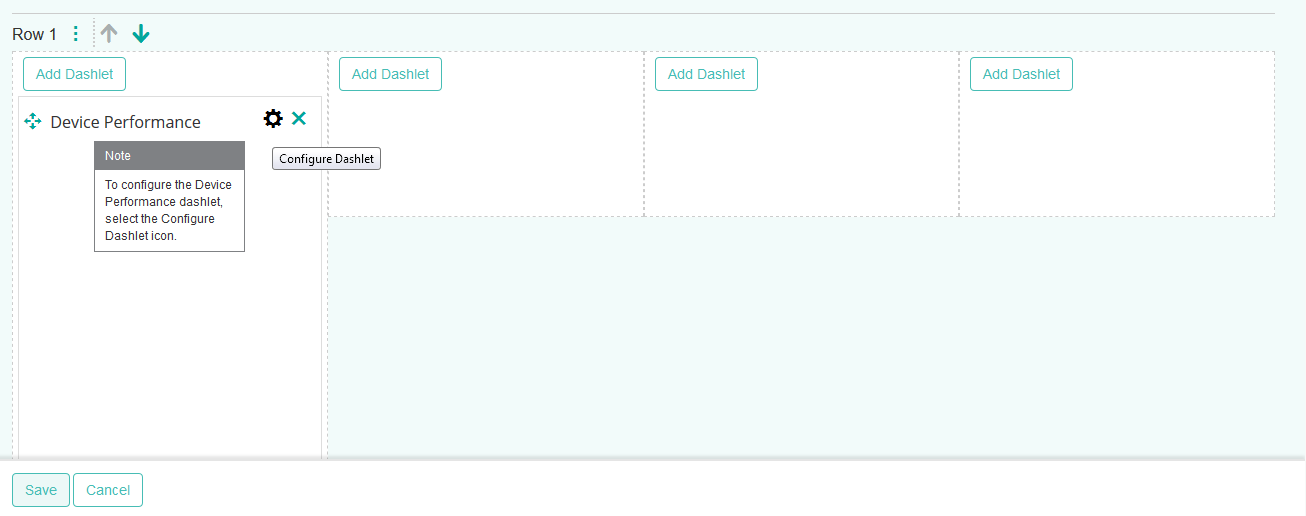
-
In the panel of input fields and options that opens below the dashboard, enter a Title for the dashlet and specify a Refresh Rate (default is 5 minutes)
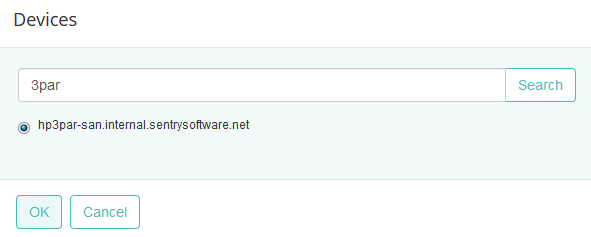
- Select the HP 3PAR storage device for which you need to compare storage pools
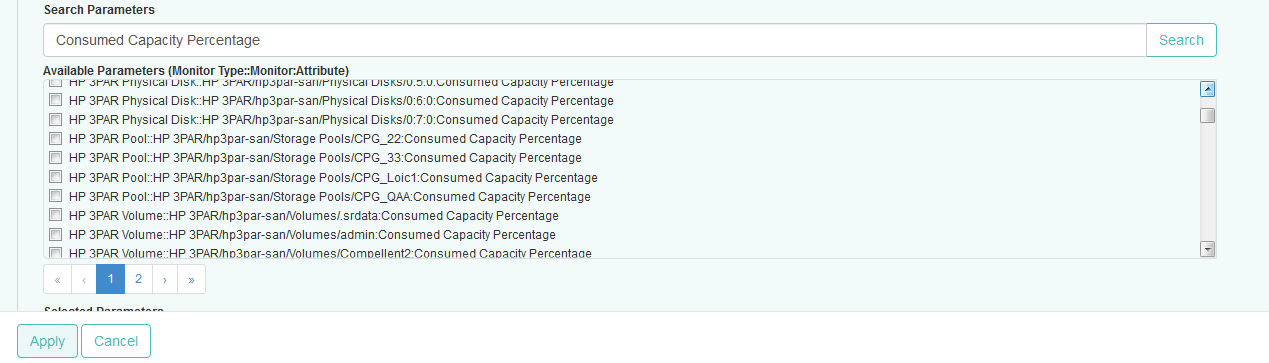
-
Select the Consumed Capacity Percentage parameter for the first storage pool, and click Apply
-
Repeat this operation in the next column(s) of the dashboard with other storage pools and click Save
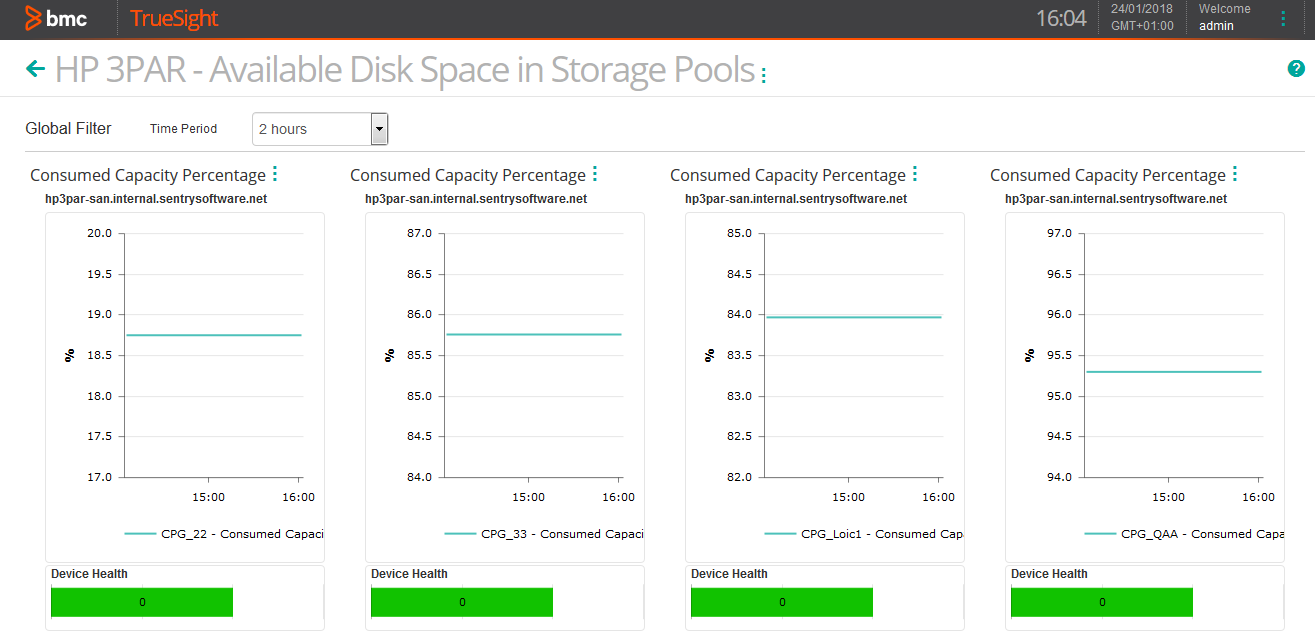
- The dashboard is completed and shows the Consumed Capacity Percentage for the selected storage pool(s).
Reclaiming Space of Unused Volumes
Identifying Unmapped (Orphans) Volumes
Over time, as servers connected to a SAN get decommissioned, administrators find an increasing number of unmapped volumes, or volumes that are no longer used by any server. These volumes, while unused, still occupy disk space in the storage system. Being able to identify such unmapped volumes and reclaim the disk space uselessly consumed by these volumes will help administrators avoid unnecessary upgrades and extensions of their storage systems.
To know which volumes are not mapped to any server and therefore safe to remove, you will have to schedule the Virtual Volumes Mapping Table report as described below:
-
Edit your HP 3PAR monitoring policy:
- Log on to the TrueSight console.
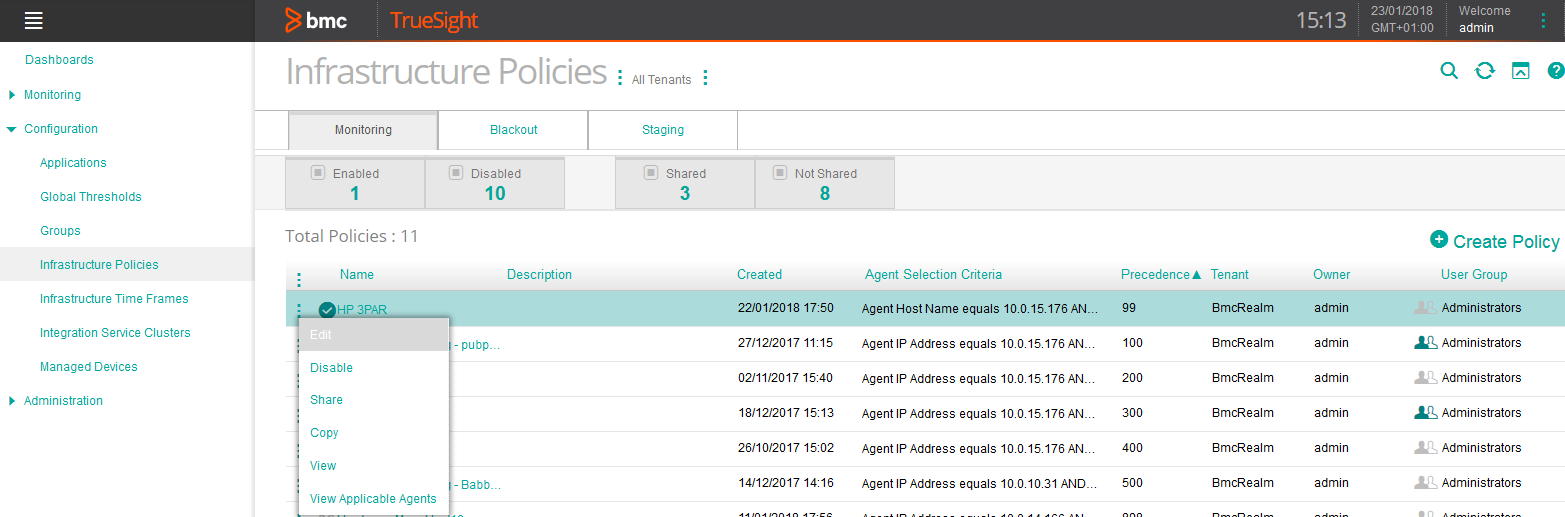
- In the navigation pane, expand Configuration and select Infrastructure Policies.
- In the Infrastructure Policies page, locate the monitoring policy you wish to modify, click its action button and click Edit.
- In the Edit Monitoring Policy page, locate the HP 3PAR Storage Configuration you wish to modify and click its action button to access the monitoring options panel.
-
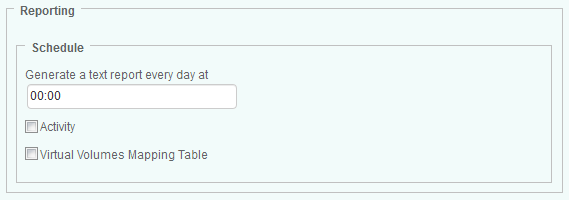
Locate the Reporting section:
-
In the Schedule section, indicate the time at which the Virtual Volumes Mapping Table report must be generated
- Check the Virtual Volumes Mapping Table box. The .csv file generated for this report consists in the following comma-separated data: Host WWN, Virtual Volume, Storage System, Size and Status.
- Click OK
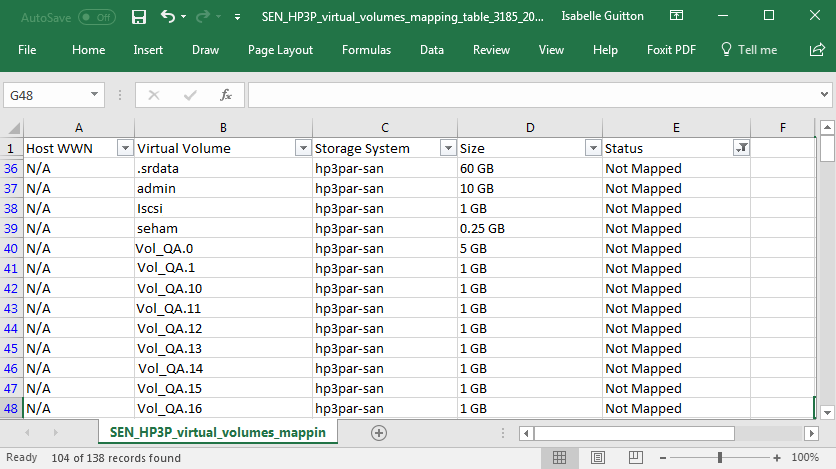
- Click Save. The generated file is time-stamped and stored in %PATROL_HOME%\log.
- Open the csv file in Excel and only display the Not Mapped volumes:
Identifying Unused Volumes
When a server is decommissioned or reconfigured, its associated volumes can stay mapped preventing storage administrator from accurately identifying unused volumes. Since the HP 3PAR KM for PATROL monitors permanently the traffic on each volume, it becomes easy to detect volumes for which the activity is null.
- Log on to the TrueSight console
- Select Dashboards from the navigation pane
- In the Dashboards page, click Add Dashboard or select Add Dashboard from the dashboard action menu
- Enter a Title for your dashboard and configure a Global Filter, if needed
- Click Add Dashlet to open the dashlet library for the first column of the row
- From the dashlet library, select the Monitors - Top/Bottom Performers template, and then click Close
-
Select Configure Dashlet by clicking the
button -
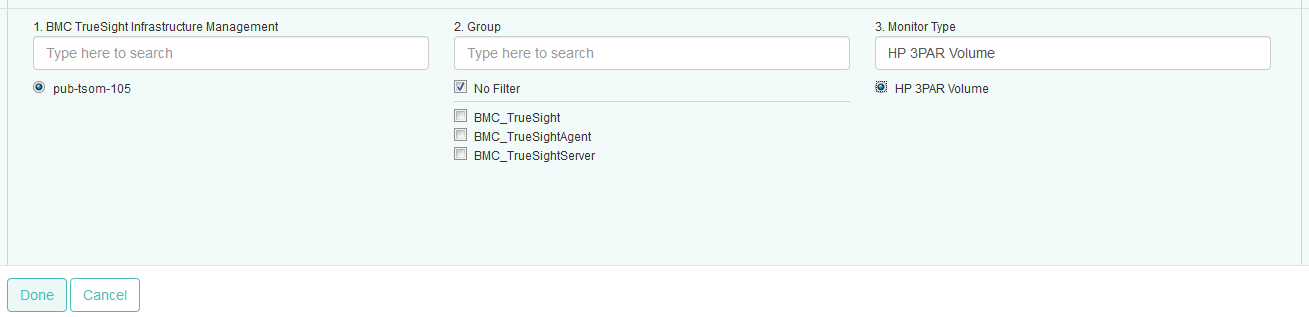
Select the Monitor Type for which you want to create a graph. In our example, HP 3PAR Volume
-
Configure the graph parameters:
- In the Type field, select Top N Graph,
- In the Number of Bars field, select the number of volumes for which you need to compare activity (default is 10)
-
Set the Refresh Rate.
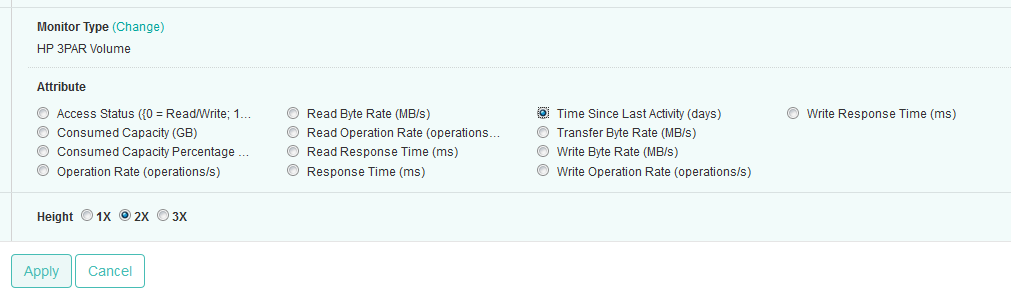
- Select the Time Since Last Activity parameter, and click Apply.
-
Click Save.
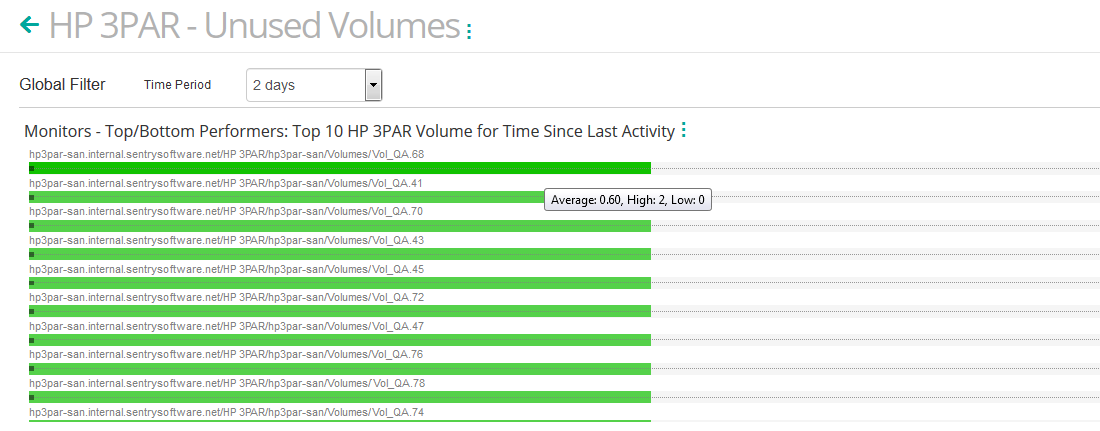
- The dashboard is completed and shows the top x volumes with the higher number of days of inactivity. Pass the mouse over a bar to view the average, high and low values for a volume.
Performance Optimization
Diagnosing a Bad Physical Disk Layout
A non-optimal physical disk layout can cause one single physical disk to become the bottleneck of a SAN. To verify that the amount of data being read/written on a physical disk is well-balanced over time across all physical disks, you need to compare the throughput of read/write data for each physical disk in your HP 3PAR storage systems.
To compare the I/Os of physical disks, you will need to create a dashboard. Dashboards allow you to gather specific types of data and display them in a consolidated graphical format. For detailed information about dashboards options and features, refer to the BMC documentation.
- Log on to the TrueSight console
- Select Dashboards from the navigation pane
- In the Dashboards page, click Add Dashboard or select Add Dashboard from the dashboard action menu
- Enter a Title for your dashboard and configure a Global Filter, if needed
- Click Add Dashlet to open the dashlet library for the first column of the row
- From the dashlet library, select the Device Performance template, and then click Close
-
Select Configure Dashlet by clicking the
button -
In the panel of input fields and options that opens below the dashboard, enter a Title for the dashlet and specify a Refresh Rate (default is 5 minutes)
- Select the HP 3PAR storage device for which you need to compare physical disks I/Os
-
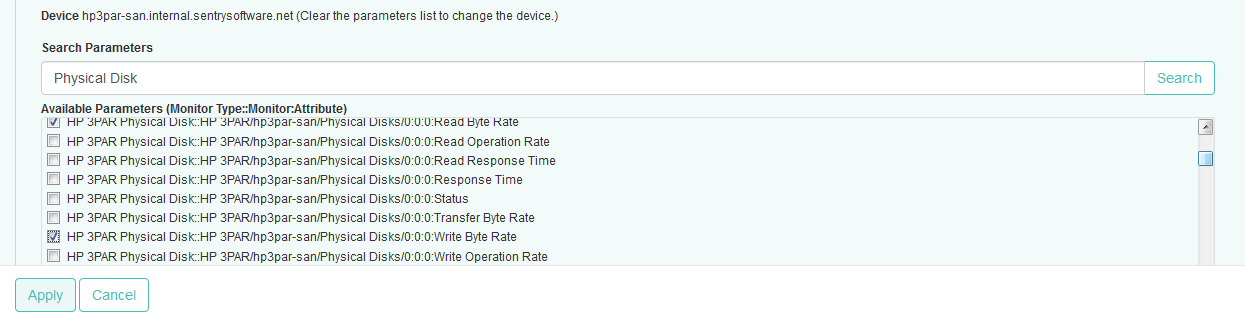
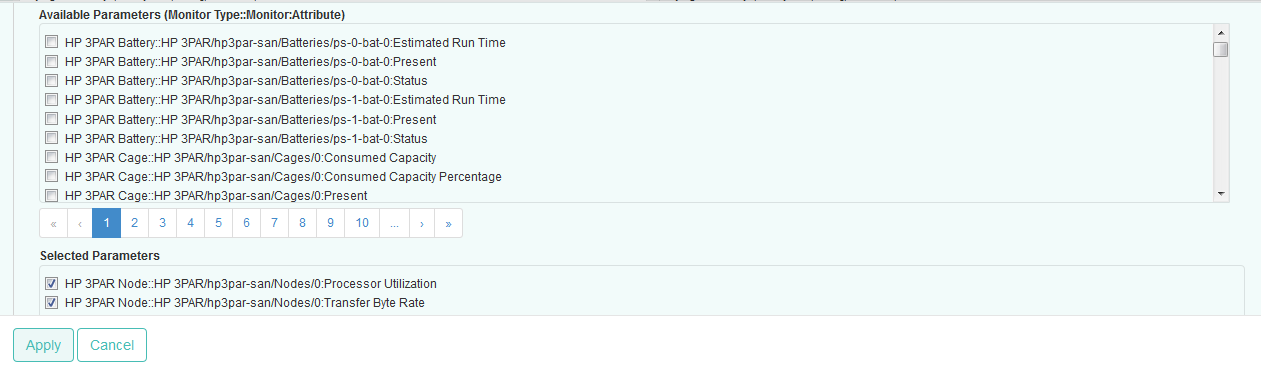
Select the Read Byte Rate and Write Byte Rate parameters for the first physical disk, and click Apply
-
Repeat this operation in the next column(s) of the dashboard with other physical disks and click Save
- The dashboard is completed and shows the Read Byte Rate and Write Byte Rate parameters for the selected physical disks
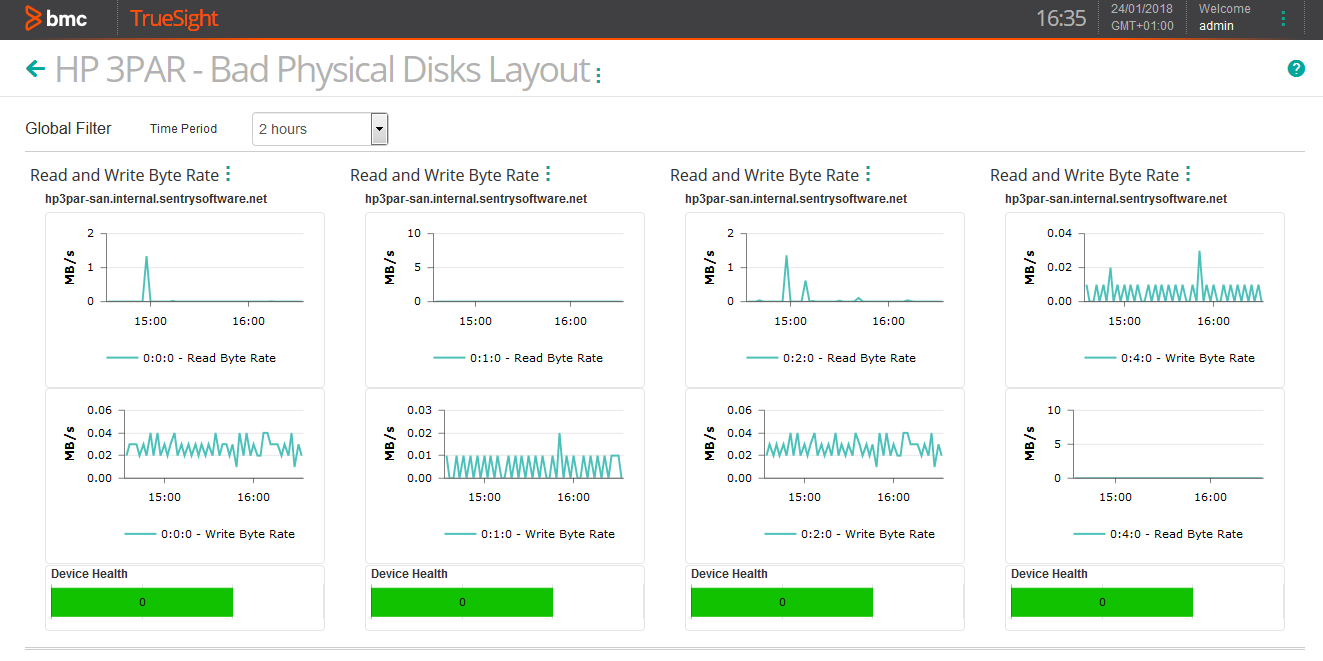
-
Verify that the Read Byte Rate and Write Byte Rate parameters of all the physical disks have similar average values to ensure that I/Os are well-balanced across all physical disks.
Detecting High Processor Utilization
Detecting a high processor utilization is crucial to prevent nodes to overload and cause critical performance degradations. To detect high processor utilization, you need to compare the actual processor utilization and the overall device throughput to determine which node may constitute a bottleneck.
To compare the utilization of nodes, you will need to create a dashboard. Dashboards allow you to gather specific types of data and display them in a consolidated graphical format. For detailed information about dashboards options and features, refer to the BMC documentation.
To detect high processor utilization:
- Log on to the TrueSight console
- Select Dashboards from the navigation pane
- In the Dashboards page, click Add Dashboard or select Add Dashboard from the dashboard action menu
- Enter a Title for your dashboard and configure a Global Filter, if needed
- Click Add Dashlet to open the dashlet library for the first column of the row
- From the dashlet library, select the Device Performance template, and then click Close
- Select Configure Dashlet by clicking the button
-
In the panel of input fields and options that opens below the dashboard, enter a Title for the dashlet and specify a Refresh Rate (default is 5 minutes)
- Select the HP 3PAR storage device for which you need to compare the processor utilization of the nodes
-
Select the Processor Utilization and Transfer Byte Rate parameters for the first node, and click Apply
-
Repeat this operation in the next column(s) of the dashboard with other nodes and click Save
- The dashboard is completed and shows the Processor Utilization and Transfer Byte Rate for the nodes
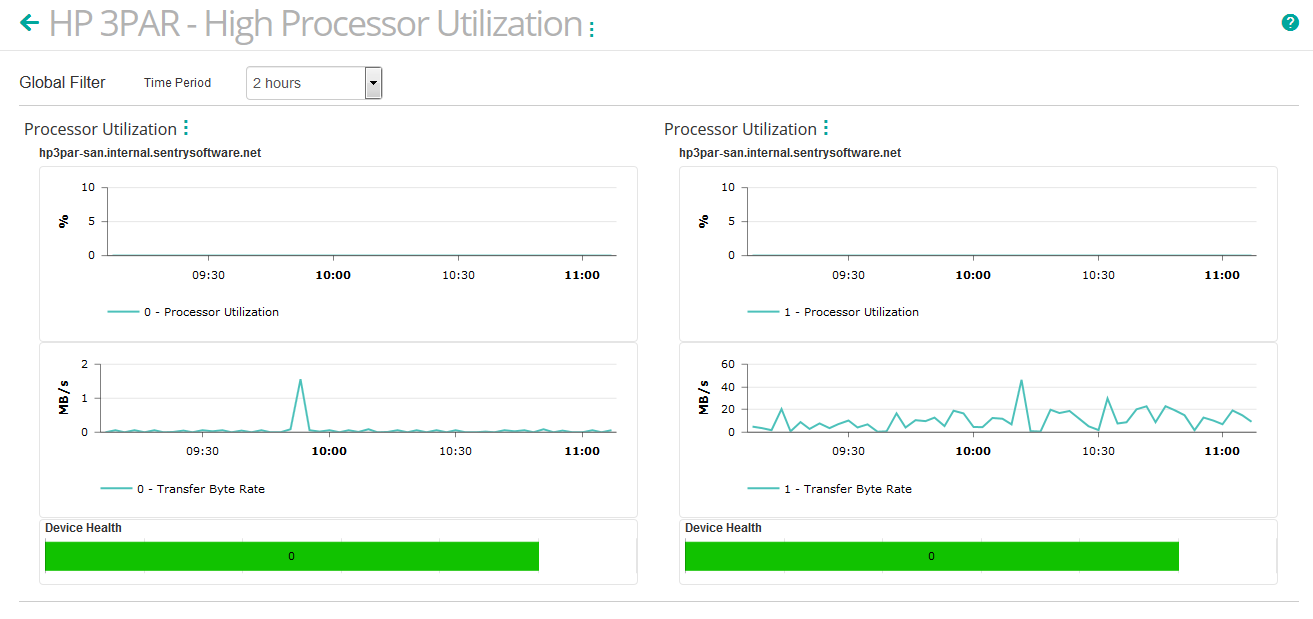
This dashboard allows you to easily compare the Processor Utilization and Transfer Byte Rate for two nodes. Make sure that the Processor Utilization is lower than 80%. A processor utilization over 80% highlights a potential overloaded situation and indicates that the node may constitute a bottleneck for the storage system.
Verify the Transfer Byte Rate of your nodes. If its value stays low – while the overall processor utilization is high – it indicates that the node is performing “non productive” tasks. It then may become critical to determine the source of activity that generates the high processor utilization.
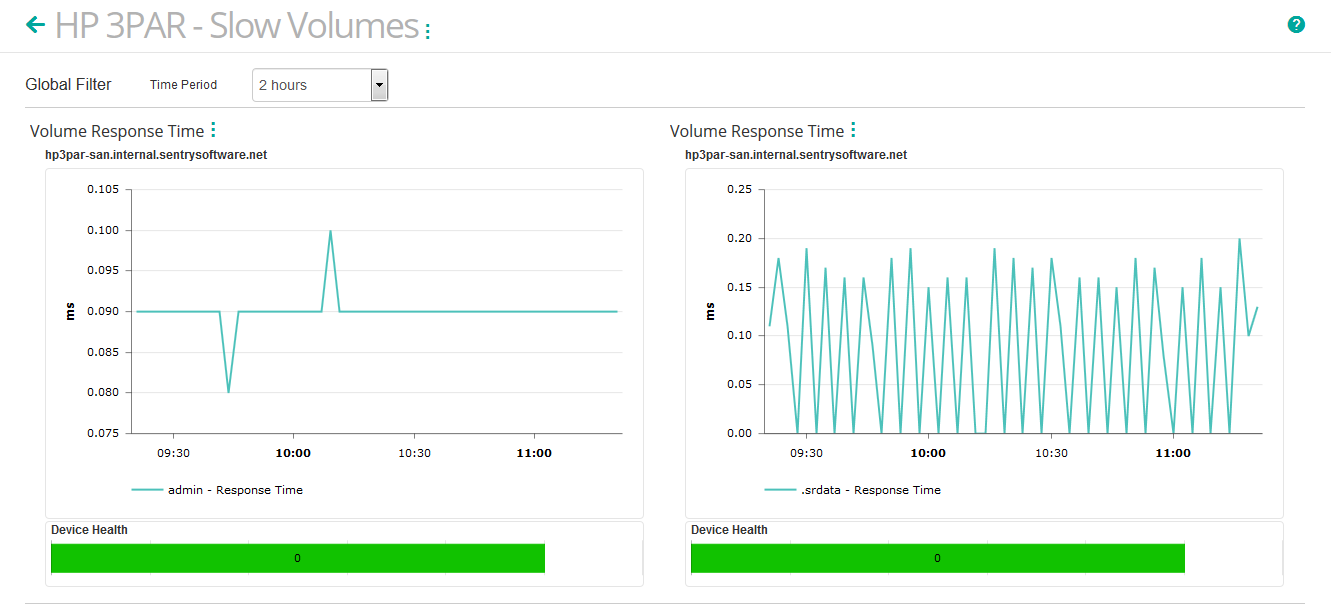
Diagnosing Slow Volumes
When servers are experiencing slow I/Os performance, you may want to verify the actual response time of the volumes the server is relying on. The response time represents the average time it takes to complete the read/write operations on a volume during the collection interval. Typically, the average response time is below 10 milliseconds. You may also want to compare this value with other volumes response time to find out if they have relatively similar throughput or if one server is really getting worse I/O performance than another.
The industry common guidelines in terms of response time are:
| Response Time | performance |
|---|---|
| Less than 10 ms | Very good |
| Between 10 – 20 ms | OK |
| Between 20 – 50 ms | Slow, needs attention |
| Greater than 50 ms | I/O bottleneck |
To identify slow volumes, you will need to create a simple dashboard. Dashboards allow you to gather specific types of data and display them in a consolidated graphical format. For detailed information about dashboards options and features, refer to the BMC documentation.
To diagnose slow volumes:
- Log on to the TrueSight console
- Select Dashboards from the navigation pane
- In the Dashboards page, click Add Dashboard or select Add Dashboard from the dashboard action menu
- Enter a Title for your dashboard and configure a Global Filter, if needed
- Click Add Dashlet to open the dashlet library for the first column of the row
- From the dashlet library, select the Device Performance template, and then click Close
-
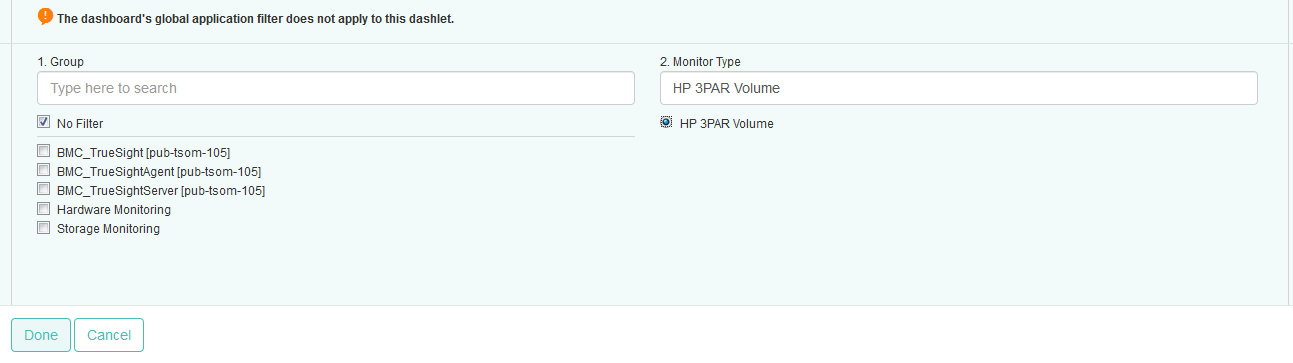
Select Configure Dashlet by clicking the
button -
In the panel of input fields and options that opens below the dashboard, enter a Title for the dashlet and specify a Refresh Rate (default is 5 minutes)
- Select the HP 3PAR storage device for which you need to compare volumes response times
-
Select the Response Time parameter for the first volume, and click Apply
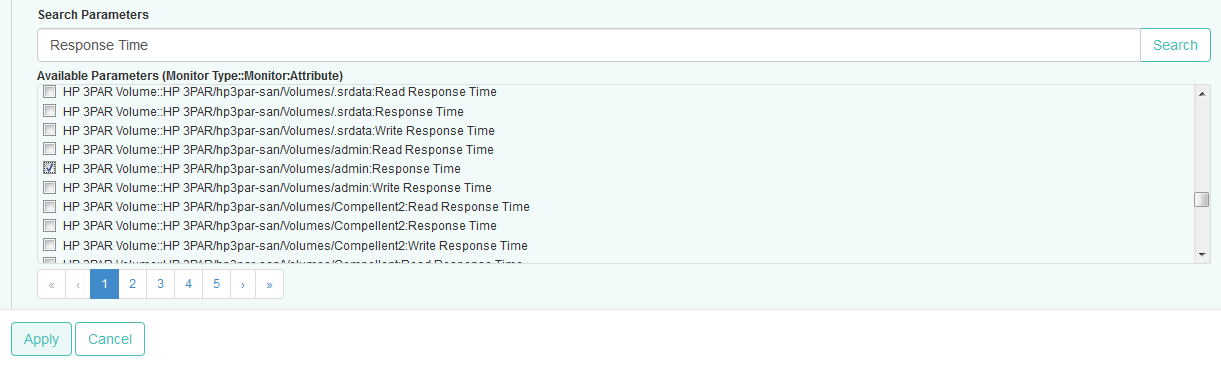
-
Repeat this operation in the next columns of the dashboard for other volumes and click Save
- The dashboard is completed and shows the Response Time for all the selected volumes.
If the response time is high, you will need to check the amount of data that is written and read on this volume. The bad performance may simply be due to an abnormally large amount of data to process.
Traffic Management
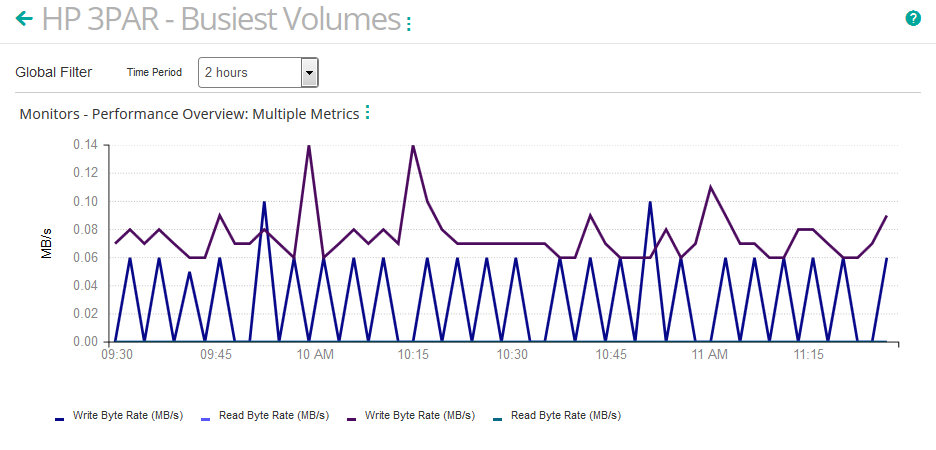
Identifying Busiest Volumes
To identify the volumes that generate the most traffic on the disk array, you can use the Read Byte Rate and Write Byte Rate parameters of the HP3P Volume Monitor.
- Log on to the TrueSight console
- Select Dashboards from the navigation pane
- In the Dashboards page, click Add Dashboard or select Add Dashboard from the dashboard action menu
- Enter a Title for your dashboard and configure a Global Filter, if needed
- Click Add Dashlet to open the dashlet library for the first column of the row
- From the dashlet library, select the Monitors - Performance Overview template, and then click Close
-
Select Configure Dashlet by clicking the
button -
From the Focus list, select Multimetric comparison
- Select the Monitor Type for which you want to create a graph. In our example, HP 3PAR Volume
-
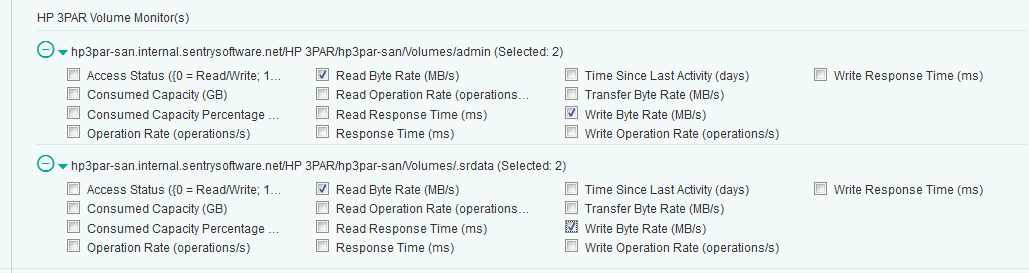
Select the Volumes Monitors to be displayed in the graph and click Done
- For each selected volume, check the Read Byte Rate and Write Byte Rate parameters and click Apply
-
Click Save
- The dashboard is completed and shows the busiest volumes.
Generating Activity Reports
HP 3PAR KM for PATROL can automatically produce text reports that provide detailed and valuable information about your monitored storage systems.
To schedule the generation of activity reports:
-
Edit your HP 3PAR monitoring policy:
- Log on to the TrueSight console.
- In the navigation pane, expand Configuration and select Infrastructure Policies.
- In the Infrastructure Policies page, locate the monitoring policy you wish to modify, click its action button and click Edit.
- In the Edit Monitoring Policy page, locate the HP 3PAR Storage Configuration you wish to modify and click its action button to access the monitoring options panel.
-
Locate the Reporting section:
-
In the Schedule section, indicate the time at which the report(s) must be generated
- Check the Activity report type to automatically generate the following reports:
- Storage Systems Activity: Reports on Transfer, Received and Sent Bytes for all monitored storage systems
- Nodes Activity: Reports on Transfer, Read and Write Bytes for all monitored nodes
- FC, Ethernet, and SAS Ports Activity:Reports on Transfer, Received and Sent Bytes for all monitored fiber ports
- Storage Pools Activity: Reports on Transfer, Read and Write Bytes for all monitored storage pools
- Volumes Activity: Reports on Transfer, Read and Write Bytes for all monitored volumes
- Physical Disks Activity: Reports on Transfer, Read and Write Bytes for all monitored physical disks
- Click OK
- Click Save.
The generated file(s) are time-stamped and stored in %PATROL_HOME%\log for the specific time set through the History Retention Period parameter.
hp3par km patrol