-
Home
- The Web Interface
Operating the Console
The PATROL Agent runs Knowledge Modules (KMs). KMs create instances (Monitors) to represent the systems, devices and objects they monitor. For each monitored instance, parameters are collected at a regular interval to assess its health and performance. The Console in the Web-based interface of Monitoring Studio X shows all monitored instances and collected parameters, and their current status.

The main view will adapt its content to the selected object. Data displayed on the page is live and is refreshed automatically every 5 seconds. The automatic refresh can be disabled with the corresponding button.
KMs
The default view (when you select the top-level KMs object) lists all of the KMs installed and running on the PATROL Agent and the main instances they have created (root instances).
The TRIGGER DISCOVERY button allows you to trigger a Discovery for all KMs. This is the equivalent of the Force discovery KM Command in the PATROL Classic Console.
The REFRESH button triggers a refresh of the data displayed in the page. It does not trigger a collect on the agent.
Instances (Monitors)
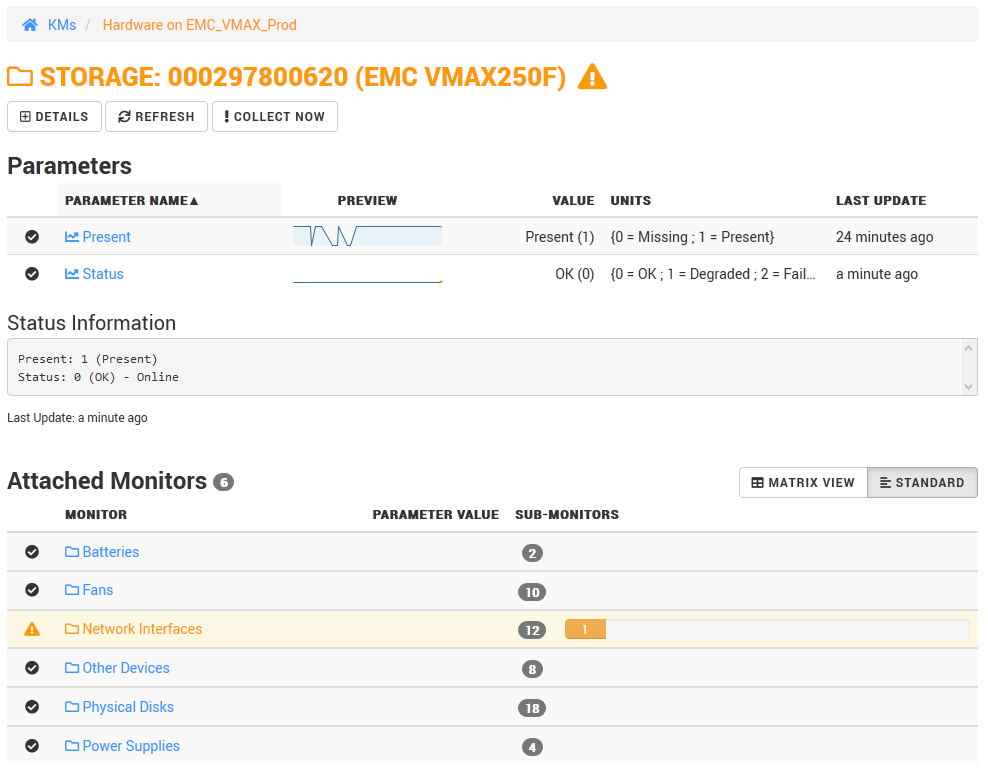
When you select a monitored instance, the Console displays its collected parameters and its Attached Monitors, i.e. other monitored instances that are attached to it, if any.

Attached Monitors can be displayed in two ways:
- MATRIX VIEW: All instances of the same class are represented in a table, with the values of the collected parameters in different columns. This view allows you to have a quick overview of an entire class of Monitors.
- STANDARD VIEW: All instances and their collected parameters are listed at once, with a bar representing their own Sub-Monitors. This view allows you to easily navigate the tree of all monitored instances.
The DETAILS button displays additional information about the selected instance (Monitor). The list of available properties depends on the KM to which the instance belongs. If available, the list of properties includes a link to the online help of the corresponding class.
The REFRESH button triggers a refresh of the data displayed in the page. It does not trigger a collect on the agent.
The COLLECT NOW button triggers an actual collect on the agent for the selected instance. If no collector is available for the selected instance, the action takes place on its parent, and so on. The display is automatically refreshed after 5 seconds. If the collect takes more than 5 seconds to complete, the view will appear unchanged. Make sure to check the Last Update field in the parameters table to see whether they have been updated already.
Depending on the class and the KM to which the selected instance belongs, other action buttons will be available.
On all Monitoring Studio X objects, the:
- PAUSE and RESUME buttons respectively pauses and resumes the collect
- EDIT IN STUDIO button allows you to display and edit the corresponding Studio object (Host, Template or Monitor)
On applicable Monitoring Studio X objects, the RESET ERROR COUNT button (also labeled RESET LINE COUNT, RESET EVENT COUNT, or RESET TRAP COUNT) resets the corresponding parameter to zero. Use this button for Count parameters that are not reset automatically and may stay in alarm forever.
On all dynamic objects (X_DYNAMIC instance), the RESET AND REDISCOVER button resets all the dynamic instances and perform a rediscovery.
On all dynamic objects that are reported as missing (Present=0), the REMOVE button removes the instance.
Parameters
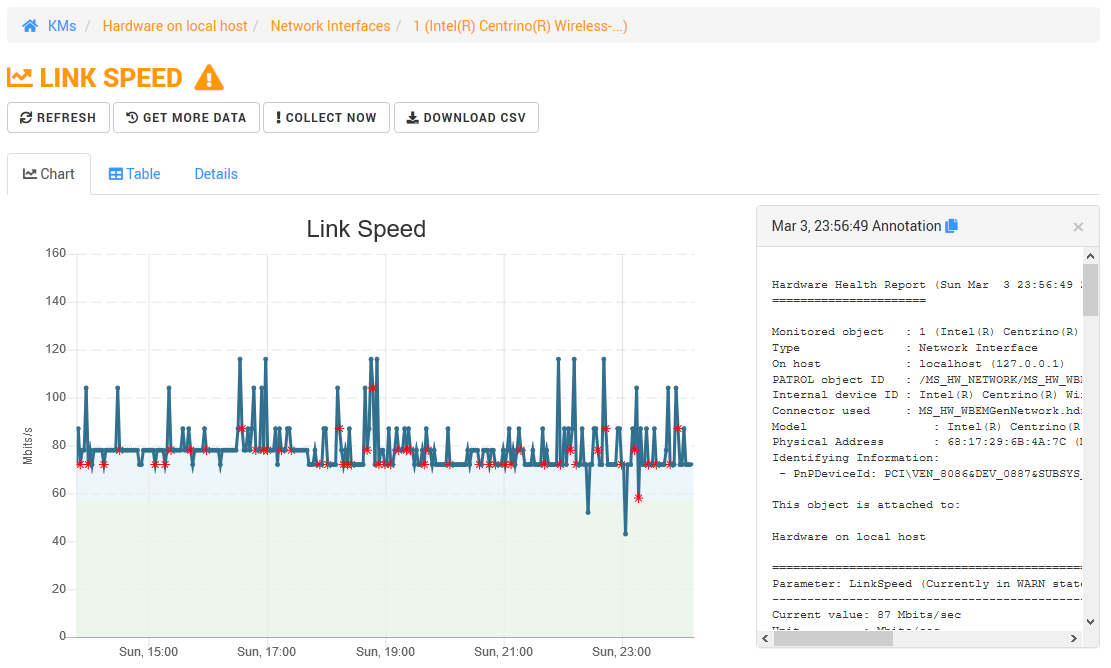
This view shows the values of the selected parameter, as stored over time in the history of the PATROL Agent, as a graph and as a table.
By default, the 1000 last points are displayed. Each time you click on the GET MORE DATA button, you double the number of points, until you reach the limit of the PATROL Agent history (1 day by default, customizable in the Agent Settings). Be careful: your browser may struggle to render thousands of points at once.
Note that best effort is made by Monitoring Studio X to interpret the units of the parameter and render enumerations values as such, rather than as simple graphs.

You can scroll and zoom the graph horizontally (on the time axis) using the mouse wheel or touch gestures.
Annotation points are rendered as a red asterisk on the graph itself. You need to click on the point to get the content of the annotation point. Annotation points are also displayed in the table.
The DOWNLOAD CSV button lets you download the CSV corresponding to the data being displayed. This can be useful if you want to import such data in a spreadsheet.
In the same way as the instance (Monitor) view, the REFRESH button refreshes the data on the page to reflect the latest values and status collected by the PATROL Agent. The COLLECT NOW button triggers an execution of the collector(s) of the instance, or its parent if applicable, followed by a refresh of the page 5 seconds later.
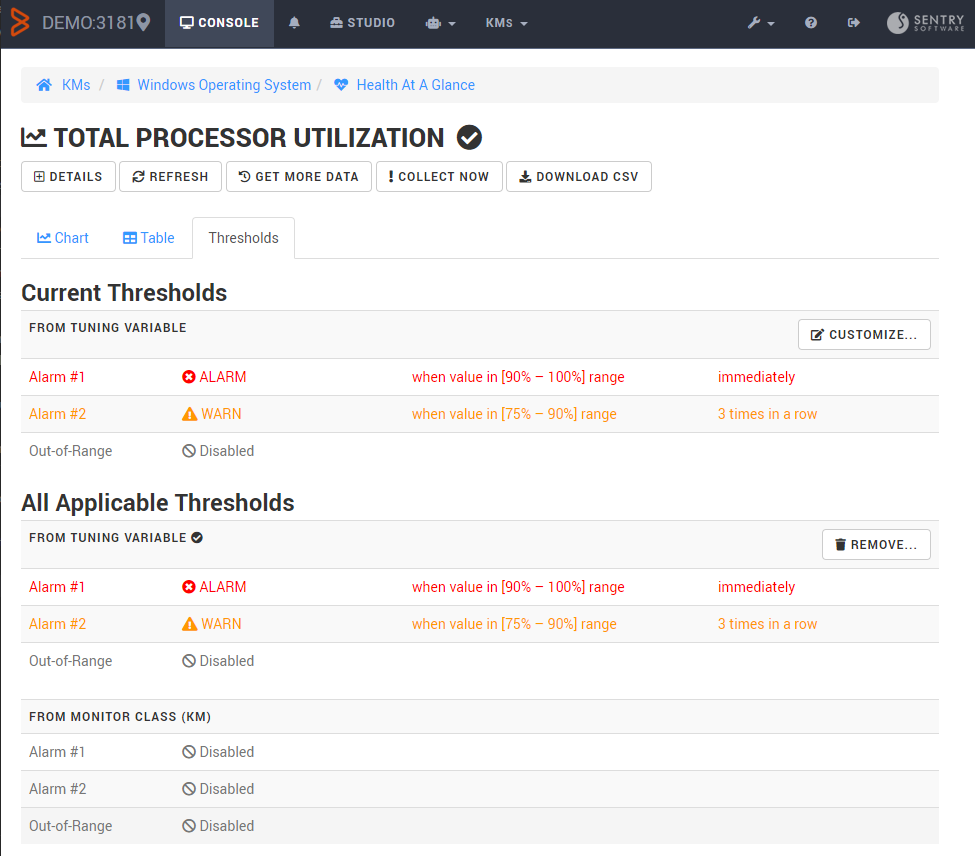
The Thresholds tab provides detailed information about the current alert thresholds and applicable thresholds on the parameter, as explained in the section below.
Thresholds
Alert thresholds are a critical feature of any monitoring solution. The Thresholds tab in the Parameter view shows all thresholds that apply to the selected parameter and allows you to customize them.

In a PATROL Agent, there are several mechanisms to define alert thresholds (listed below from lowest priority to highest priority):
- Alarm ranges defined in the Monitor class (the .km file)
- Thresholds defined under
/___tuning___in the agent's configuration (also called Overrides) - Thresholds defined in the Event Management KM (also known as AgentSpring and EventSpring), under
/ASin the agent's configuration - Agent Thresholds defined in a Monitoring Policy in CMA in TrueSight and applied on this agent
- Thresholds defined in monitoring Template in Monitoring Studio X
- Alarm ranges set programmatically with the set_alarm_ranges() PSL function
If several mechanisms are used to set alert thresholds on a parameter, only the one with the highest priority will be in effect. The Thresholds tab shows the thresholds currently applied to the parameter, and also the list of all threshold settings that could apply to the parameter, but that have been overridden by another mechanism with a higher precedence.
Note: Server Thresholds (stored and managed in TrueSight) are not displayed here as they are an entirely different alerting mechanism.
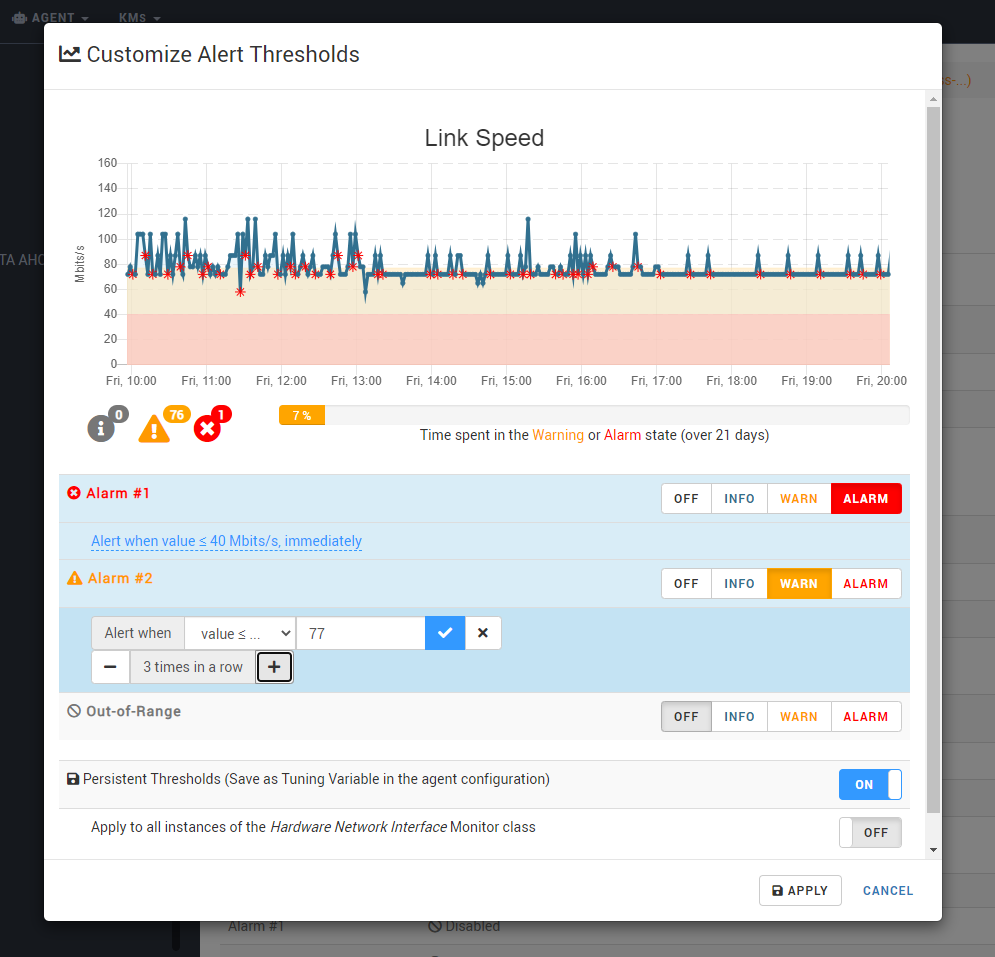
Customizing thresholds in Monitoring Studio X is done in a dynamic view that shows you the number of events that would have been generated (in the observed time period being represented in the graph) and the time spent by the parameter in the WARNING and ALARM states. This helps you setup adequate alert thresholds on the parameter and avoid triggering too many alerts.

Customized thresholds can be applied to the instance this parameter belongs to (this is the default behavior), or to all instances belonging to the same class.
Customized thresholds are stored in the PATROL Agent's configuration under /___tuning___, i.e. using the tuning mechanism (also called Overrides).
All the customized alert thresholds are listed and can be edited in the Agent > Agent Thresholds menu.