- Getting Started Overview Release Notes Installing Monitoring Studio Accessing the Web Interface
- The Web Interface Operating the Console Managing Events Configuring the Agent Other Tools
- Studio General Concepts Hosts and Templates Basic Monitors 6 Monitors with Content 11 Content Parsing Monitors 5 Alert Messages and Actions Macros Global Settings Use Cases
- Integrations TrueSight 2 Prometheus 3
- Developers PATROL REST API Documentation FREE 3rd-Party KM Extensions 2
- Appendix About Monitors and Attributes Regular Expressions
Overview
What is Monitoring Studio X?
Monitoring Studio X is a multifaceted solution:
- A standard Knowledge Module (KM) that enables you to monitor in BMC TrueSight/Helix almost any technology (application, server, device, etc.) for which there is no out-of-the-box monitoring solution
- A Web Interface that lets you configure and troubleshoot the PATROL Agent
- A fully-documented REST API to programmatically interact with the PATROL Agent
Technically, Monitoring Studio X is comprised of 2 main components:
- A KM for PATROL
- Compatible with Linux/UNIX and Windows
- Can rapidly be deployed through CMA to monitor anything, anywhere locally and remotely without coding
- Offers a Web interface on the PATROL Agent (can be disabled)
- Exposes a REST API for the PATROL Agent
- A Component for BMC TrueSight Presentation Server
- Extends BMC TrueSight's interface with deep links to the Monitoring Studio X interface
- Tunnels user interactions with the PATROL Agent through TSPS and Integration Services standard communication channels
- Exposes the same Web interface as directly on the PATROL Agent
- Exposes the same REST API as directly on the PATROL Agent
Architecture
Monitoring Studio X can work as a standalone monitoring solution for small environments, requiring only a PATROL Agent as in the diagram below:

More typically, Monitoring Studio X will be setup in large BMC TrueSight/Helix environments as in the diagram below:

Standard KM for PATROL
Monitoring Studio X offers a large choice of Monitors, Basic Monitors, Monitors with Content, Content Parsing Monitors easily configurable to discover, monitor and collect information about the targeted technology.
Monitoring Studio X allows you to perform:
- Command line executions
- HTTP and REST API requests
- Files parsing
- File systems monitoring
- Folders listing
- Processes monitoring
- PSL command execution
- SNMP queries
- SNMP traps listening
- SQL queries
- WBEM queries
- WMI queries
- Windows events monitoring
- Windows performance counters reading
- Windows services monitoring
The collected metrics of some of the above Monitors can be analyzed by searching for strings and regular expressions, extracting numeric values, mapping values, and creating instances dynamically to easily visualize the components of the monitored technologies.
The solution makes it easy to define alert thresholds and alert actions to detect and react to critical conditions with corrective solutions.
The configuration of the above Monitors is grouped inside what is called a Template, typically targeted at the monitoring of a given technology, or application. Then, you can apply a Template to one or several Hosts. The monitoring as configured in a template will be performed on each of the configured Hosts.
Monitoring Studio X comes with a large offering of templates to configure the monitoring of uncovered technologies and offers integration capabilities with Nagios plugins.
Web Interface
FREE
The Monitoring Studio X Web Interface provides a modern, interactive and powerful way to visualize, configure and manage your monitored environment from an easy-to-use Web-based console.
The Web Interface is available directly on the PATROL Agent and also from BMC TrueSight Presentation Server. Accessing the Web Interface in BMC TrueSight requires the installation and configuration of the BMC TrueSight Component that will channel all the interactions with the PATROL Agent through TSIM and the Integration Services.
You can access the Web Interface directly on the PATROL Agent typically with the below URL:
https://agentHostname:3443
You can access the Web Interface of Monitoring Studio X in BMC TrueSight by using the links in the BMC TrueSight interface from Event details, Monitors, Devices and Managed Devices, or with the below URL:
https://tspsHostname/studio-tsps-web/?agent=agentFQDN:3181
The Web-based user interface facilitates live interactions with the PATROL Agent and comes with several menus and pages, each dedicated to specific configuration and management operations:
-
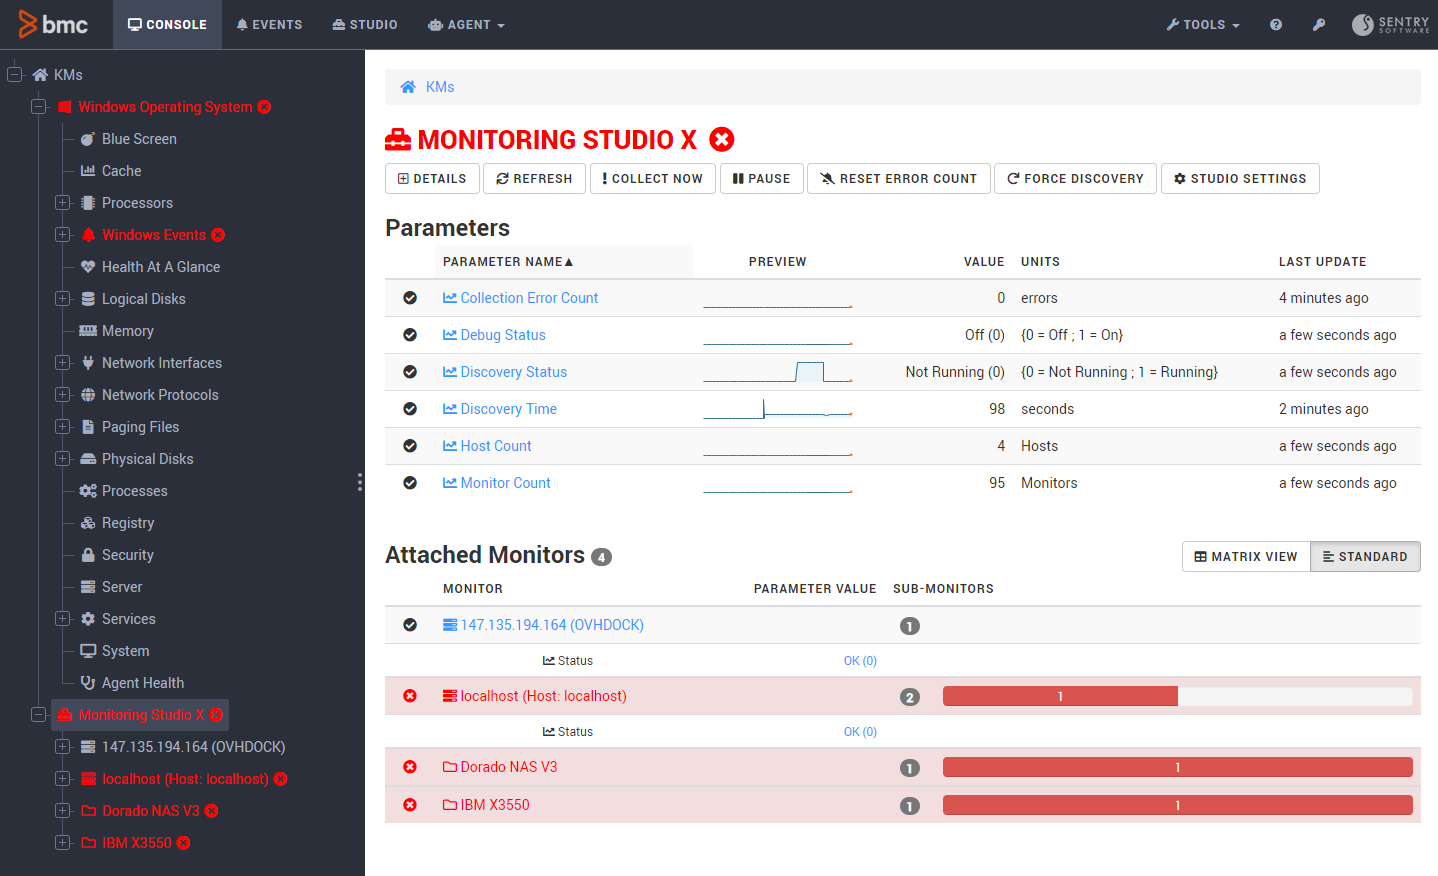
The Console page displays all the objects discovered by one PATROL Agent and their current status. Additional information is also available when selecting a specific instance or component.

-
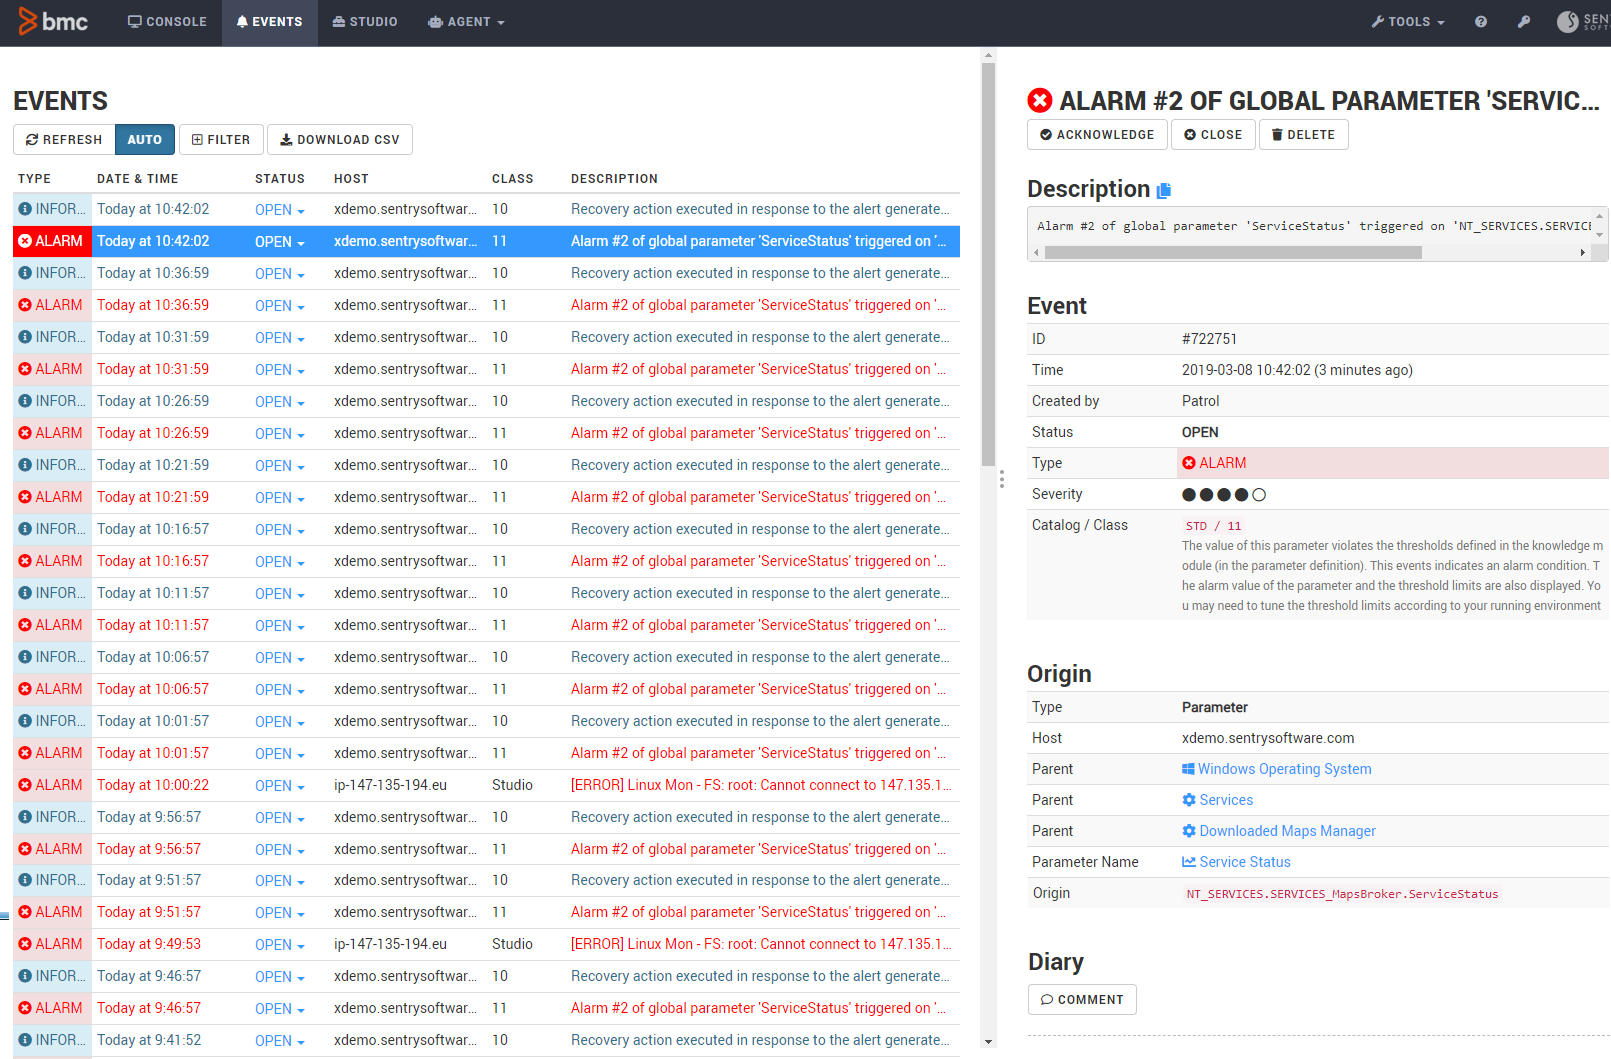
The Events page, provides details about all the events generated by a PATROL Agent (event severity, occurrence date and time, status, related host, and problem description). You can easily filter events by type or status or retrieve a specific event with the Search option. Selecting an event opens the Event Details page, where you can add comments, acknowledge, close or delete an event.
-
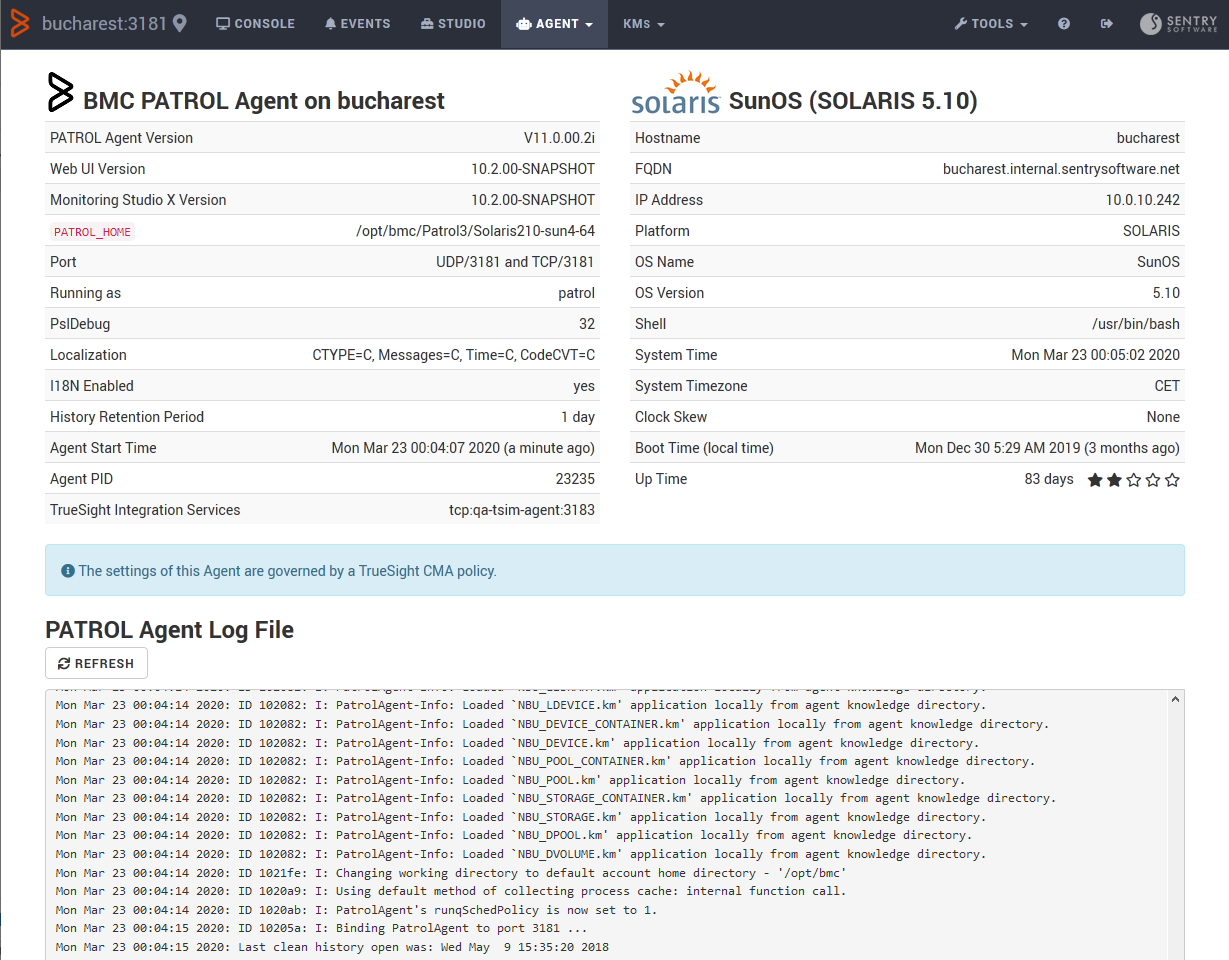
The Agent menu provides a direct access to the management of the PATROL Agent settings and the configuration of the Java and HTTP Servers properties.
-
The Studio page is dedicated to configuring the monitoring settings for any technology in your environment. Based on a logical hierarchy, each element is configured independently and attached to one another to build a modular set of properties and actions that can be arranged and reused to respond to your monitoring needs.
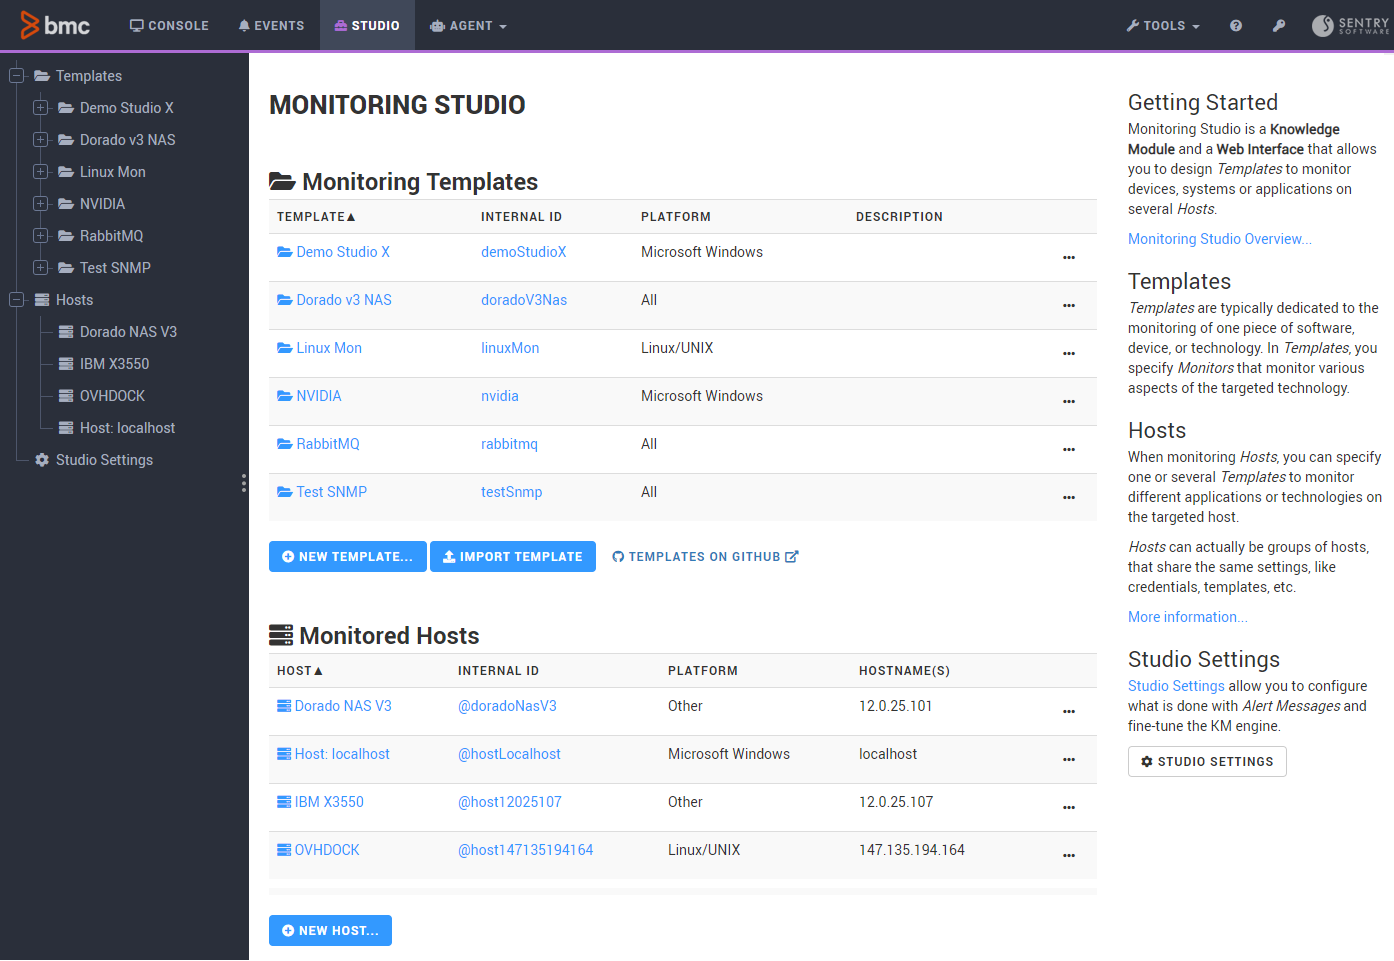
The higher level of hierarchy consists in the Hosts that provide information about the local or remote target server where the technology that needs to be monitored is installed.
Templates correspond to the technology you wish to monitor. They can be attached to one or several hosts.
Templates contain a set of Monitors configured to collect health and performance metrics from the targeted technology or application.
The Dry Run feature allows you to challenge your monitoring settings before implementing them to make sure you get the expected output or adjust the configuration if a problem is detected.
-
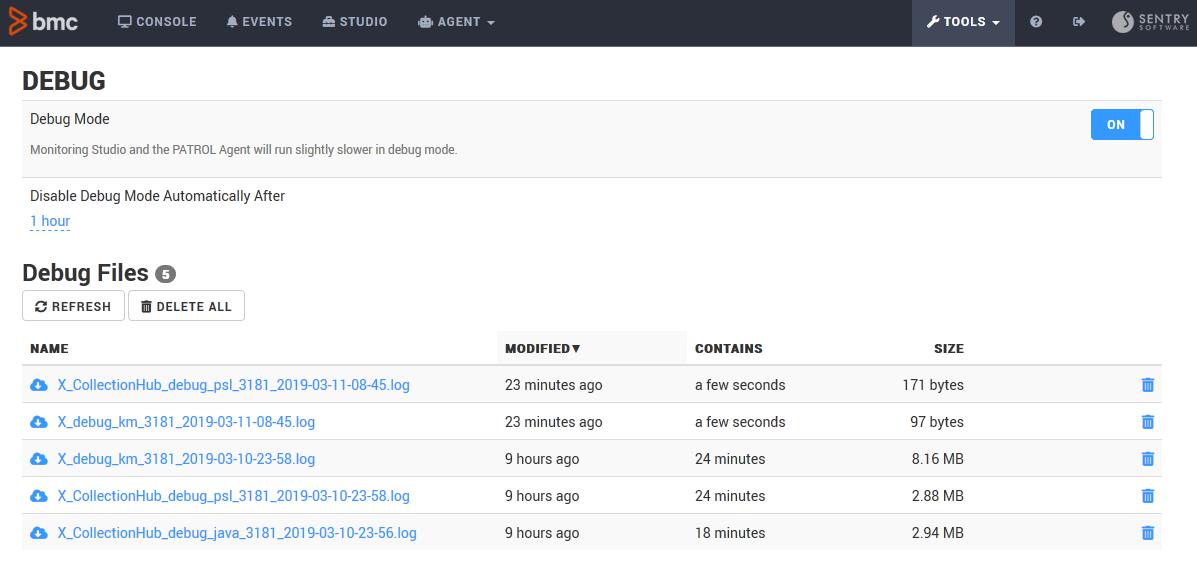
The Tools menu regroups all the necessary features to facilitate backups, troubleshooting, advanced configuration operations, and even an interactive system shell.


Refer to the Operating the Console section for details.
REST API
FREE
The REST API provided with Monitoring Studio X allows you to interact with the PATROL Agent and its main components. You gain access to:
- Agent (platform information, logs)
- Agent Configuration (pconfig)
- Events
- Console (monitored instances and parameters)
- Various tools
The Monitoring Studio X REST API leverages OAuth 2.0 for the authentication on the PATROL Agent, and the standard RSSO authentication when accessed through BMC TrueSight Presentation Server.
The REST API is fully documented using the OpenAPI standard.
The REST API can be leveraged by querying directly the PATROL Agent, typically with this URL:
https://agentHostname:3443/rest/agent
The REST API can also be accessed through TSPS, typically with this URL:
https://tspsHostname/tsws/10.0/api/studio/agentFqdn/agentPort/rest/agent
Previous Versions
Monitoring Studio v8.x, v9.x and Monitoring Studio X can run side by side without interfering with each other since their respective configuration and operating files are totally distinct. Note that installing Monitoring Studio X will not upgrade or uninstall versions 8.x or 9.x.
Configurations created with Monitoring Studio v8.x or v9.x are not compatible with Monitoring Studio X.