-
Home
- Standalone with Monitoring Studio
Troubleshoot Hardware Sentry KM for PATROL
This section describes the basic troubleshooting steps to follow before contacting Customer Support.
Performing the First Troubleshooting Steps
If you encounter issues while using Hardware Sentry KM, please complete the following steps:
- Search Sentry Software’s knowledge base for solutions for this specific issue.
- Verify that you are not experiencing connectivity issues.
- Reinitialize the KM to reset configuration and let Hardware Sentry KM re-start monitoring from scratch.
Troubleshooting Connectivity Issues
Hardware Sentry KM leverages specific instrumentation agents or system management tools to collect hardware information. Because some connectivity issues may exist and cause Hardware Sentry KM to fail, it is highly recommended to test the connection to the specific agent before contacting the Sentry Support Team.
To troubleshoot connectivity issues:
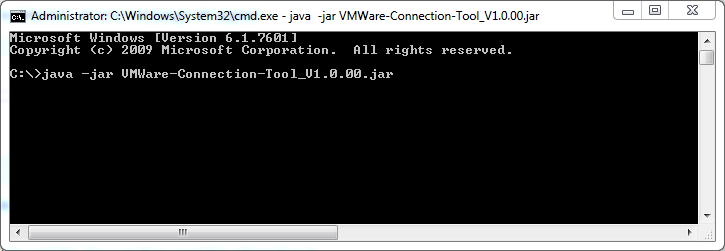
1.Download the connection tool required from the Sentry Software Web site on the machine where the PATROL agent is installed to ensure that the network traffic is allowed from the PATROL agent machine to the monitored system. Please note that the connection tool requires Java v1.6 or higher. 2. Run the command java -jar <Troubleshooting_Tool_Name.jar> to launch the connection tool.
3.Enter the information required to connect to the system.
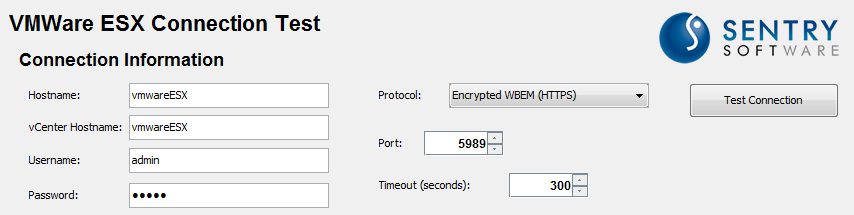
- Click Test Connection.
5.Wait for the test to complete. If a connectivity issue is detected, an error message will appear. In this case, the issue encountered does not concern Hardware Sentry KM. Check your configuration to diagnose the source of the issue.
5.Click Save As to export the connection test results into a txt file. You can then send this information to the Sentry Support Team.
Enabling Debug
When you encounter an issue and wish to report it to Sentry Software, you will be asked to enable the Debug mode and provide the following files to the Sentry Software Support team:
MS_HW_<session>_<hostid>_debug_metricshub_<port>.log: logs theMetricsHuboperationsMS_HW_<session>_<hostid>_debug_km_<port>.log: logs the discovery and collect operations of the monitored systemMS_HW_<session>_<hostid>_CollectionHub_debug_psl_<port>.log: logs the operations of the Collection Hub, the interface between PSL and the Java engineMS_HW_<session>_<hostid>_CollectionHub_debug_java_<port>.log: logs the operations of the Java engine of the Collection Hub.
Note:<session> is the session number suffixed with a random color (e.g.: 1-Spring-Green, 11-Cyan, etc.)
Click KMs > Hardware Sentry > KM Debug from the Web Console to access the KM Debug page.

From there, you can either enable debug for all your hosts by clicking ENABLE ALL or for some specific hosts. In that case, expand the HOSTS sub-section and turn ON debug for the hosts of your choice.
Then, indicate the time after which the debug mode will be disabled.
By default, all debug logs generated during a session are compressed to a single file when the time specified is reached or when debug is manually disabled (MS_HW_<session>_debug_<hostname>_<port>.tar.gz on UNIX/Linux, MS_HW_<session>_debug_<hostname>_<port>.zip on Windows. <hostname> and <port> correspond to the PATROL Agent hostname and port). If you do not want an archive to be created, turn OFF the Compress Debug Files option.
Debug files are saved to the $PATROL_HOME/log (on UNIX/Linux) or the %PATROL_HOME%\log (on Windows) directory. You can also download them directly from the Web Console, under Debug Files.
Reinitialize
When Hardware Sentry KM stops working properly or starts behaving in an unexpected manner (displays components as missing that you know are present, does not detect components as it should, stops collecting regularly, etc.), it is recommended to reinitialize the configuration and let the KM re-start monitoring from scratch.
A backup of the PATROL Agent configuration is always performed and saved in the $PATROL_HOME/config directory before a reinitialization of the KM.
To reinitialize the KM
-
Select KMs > Hardware Sentry > KMs Settings > Reinitialize
-
Click the Reinitialize… button.
-
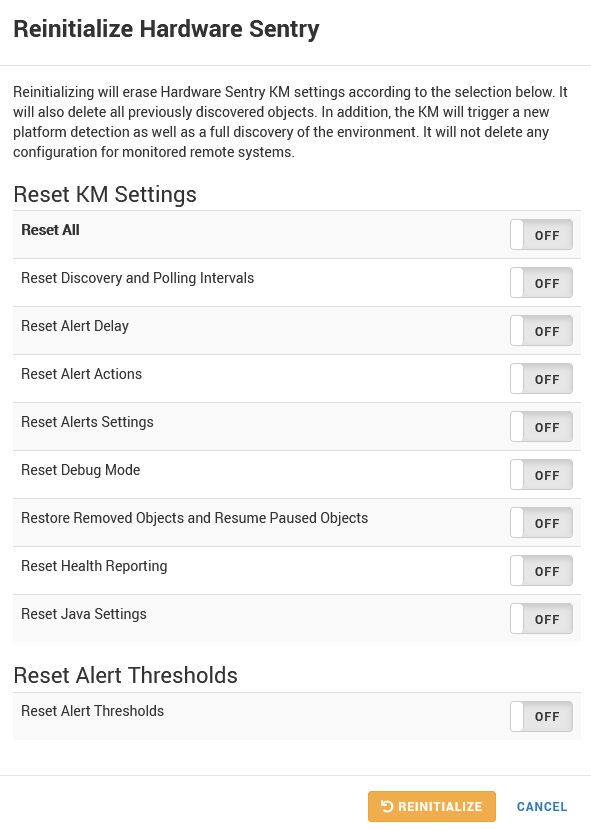
Select the options as per your specific needs:
Reset KM Settings:
- Reset All: Enables/disables the reset of all the listed settings except for Reset Alert Thresholds.
- Reset Discovery and Polling Intervals: Removes all user-defined frequencies for discovery and polling processes to their default values (respectively 1 hour and 2 minutes).
- Reset Alert Delay: Resets the number of times thresholds can be breached before triggering an alert to their default values (1 time) for numeric, discrete, connector status and present parameters.
- Reset Alert Actions: Removes all manually set Alert Actions and reverts to basic default actions i.e. Trigger a PATROL event and Annotate a parameter graph.
- Reset Alerts Settings: Reverts any manually performed configuration changes to the default Hardware Sentry KM values.
- Reset Debug Mode: Deactivates the debug mode when it was enabled and resets settings to default.
- Restore Removed Objects and Resume Paused Objects: Reactivates the monitoring of all paused or removed objects.
- Reset Health Reporting: Clears the report schedule.
- Reset Java Settings: Removes the custom Java settings (path and credentials). The KM will try to automatically find a suitable JRE.
Reset Alert Thresholds:
- Reset Alert Thresholds: Removes all predetermined and dynamic thresholds from the PATROL Agent configuration.
-
Click Reinitialize.

Running Diagnostic Commands
This chapter explains how Hardware Sentry KM provides diagnostic commands and helps gather debug information using the PSL Playground.
The PSL Playground allows you to run commands as if you were connected to a PATROL Console. Hardware Sentry KM provides access to some PSL functions to run PSL scripts and help you diagnose potential problems.
Please note that all text arguments should be delimited by quotes (ex: “text argument”). If a backslash character (\) is used, it must be doubled (ex: \\).
To perform a PSL Command
From the Tools menu, select PSL Playground. In the left pane, specify the query and click Execute.
Global Reports Queries
Global reports provides information about the PATROL Agent and the hosts associated to the PATROL Agent.
Local Report
requires MS_HW_q; print(localReport());
This command gathers information about the PATROL Agent Environment (loaded KMs, connected consoles, running processes, environment variables, PATROL configuration).
Hosts Summary
This summary can be used to identify the host ID to use for running host commands.
requires MS_HW_q; print(hostsInfo());
This command returns a table containing the following host information:
- ID
- Hostname
- OS
- IP Address
- FQDN
- Objects Count
- Connectors
Hosts Report
requires MS_HW_q; print(hostsReport());
This command returns a table containing the following information for each existing host:
- Network report
- Objects report
- Connectors report
Class Report()
requires MS_HW_q; print(classReport(objectType/classname,hostID));
This command displays the list of devices for the specified object type/class. The following arguments can be used:
- objectType/classname: Object type or class name for which instances should be listed (Battery, Blade, CPU Core, Connector, Disk Controller, Enclosure, Fan, LED, LUN, Logical Disk, Memory Module, Network Interface, Other Device, Physical Disk, Power Supply, Processor, Robotics, Tape Library, Temperature, Voltage).
- hostID: Host PATROL ID. When the hostID is provided, this command reports instances of the class for the specified host. If left empty, it reports all instances.
Full Report
requires MS_HW_q; print(fullReport());
This command gathers consolidated environment information that contains the following reports:
- Local
- Collection hub
- Hosts report (network, object count, connectors report)
Depending on the number of monitored hosts, this command may take time to execute.
Product Report()
requires MS_HW_q; productReport(filename);
This command generates the product report information (Product version, KM version, libraries and connectors, etc.). The following argument can be used:
- filename: Path to the filename on the PATROL Agent where the report will be saved. If not provided, this command displays the report in the Agent Query window.
Dump Namespace()
requires MS_HW_q; print(dumpNamespace(filename));
This command reports on the product namespace information. The following argument can be used:
- filename: Path to the filename on the PATROL Agent where the report will be saved. If not provided, this command displays the report in the Agent Query window.
Host Reports Queries
Hosts reports queries provides information related to the specified host.
The host argument corresponds to the PATROL ID of the host as provided in the interface.
Network Report
requires MS_HW_q; print(networkReport("<host ID>"));
This command returns the following information for the specified host:
- System type
- Hostname
- IP
- FQDN
- Domain
Objects Report
requires MS_HW_q; print(objectsReport("<host ID>"));
This command returns a list of the component types discovered on the PATROL Agent for the specified host and indicates the total number of discovered component types.
Connectors Report
requires MS_HW_q; print(connectorsReport("<host ID>"));
This command returns the content of the TestReport parameter for each discovered connector instance of the specified host.
SNMP Report
requires MS_HW_q; print(snmpReport("<host ID>"));
This command gathers SNMP information such as the list of SNMP sub-agents and performs an SNMP dump if the SNMP protocol is available and configured for the specified host.
Other Queries
The following queries rely on the host settings (username, password, etc.) and a discovery must be completed for these settings to be properly registered and accessible.
The queries return their status (success or failure) and the associated result or error message.
Command-line
requires MS_HW_q; print(command(host ID,command,timeout,executeLocally,username,password,keyFile));
This command can use the following arguments:
- host: If a Host ID is provided, simply provide the command to execute and other argument values will automatically be retrieved from the configuration. If a hostname or IP address is provided, add the arguments you want to retrieve to the query.
- command: command to execute.
- timeout: command timeout in seconds. Default: 30
- executeLocally: indicate whether the command should be executed on the PATROL Agent (1) or the remote host (0). Default: 1
- username: username to use for executing the query
- password: password in plain text
- keyFile: path to the private key file on the localhost
SNMP Get
requires MS_HW_q; print(snmpGet(hostID/IP,oid,snmpVersion,port,timeout,community,retryIntervals, authenticationprotocol,username,authenticationpassword,privacyprotocol,privacyPassword,context));
This command requires the following arguments:
- host: either the hostID (PATROL ID of the host that will be used to execute the SNMP query) or a hostname/IP. If a hostID is provided, then the function only needs the OID to query. All settings are read from the PATROL Agent configuration. If a hostname/IP is provided, the optional relevant arguments need to be provided.
Optional arguments:
- snmpVersion is either 1, 2 (or 2c) or 3:
- snmp Version 1: port (default: 161), timeout (default: 60 - read from PATROL configuration), community,oid, or
- snmp Version 2: port (default: 161), timeout (default: 60 - read from PATROL configuration), community, retryIntervals (default read from PATROL configuration) oid, or
- snmp Version 3: port, timeout, snmpRetryIntervals, oid, authenticationProtocol, username, authenticationPassword, privacyProtocol, privacyPassword, context
- timeout: SNMP query timeout in seconds
- passwords: password in plain text
SNMP Walk
requires MS_HW_q; print(snmpWalk(hostID/IP, oid, snmpVersion, port, timeout, community, retryIntervals, authenticationprotocol, username,authenticationpassword, privacyprotocol, privacyPassword, context));
- hostID/IP: The host is either the hostID (PATROL ID of the host that will be used to execute the SNMP walk ) or a hostname/IP. If a hostID is provided, then the function only needs the OID to query. All settings are read from the PATROL agent configuration. If a hostname/IP is provided, the relevant optional arguments need to be provided.
Optional arguments:
- snmp Version 1: community, port (default: 161), timeout (default: 60 - read from PATROL configuration), oid
- snmp Version 2 (or 2c): community, port (default: 161), timeout (default: 60 - read from PATROL configuration, retryIntervals (default read from PATROL configuration)oid, or
- snmp Version 3: port, timeout, snmpRetryIntervals, oid, authenticationProtocol, username, authenticationPassword, privacyProtocol, privacyPassword, context
- timeout: SNMP query timeout in seconds
- password: password in plain text
WBEM
requires MS_HW_q; print(wbem(host, query, namespace, port, timeout, protocol, username, password));
This command requires the following arguments:
- host: either the hostID (PATROL ID of the host that will be used to execute the WBEM query) or a hostname/IP. If a hostID is provided, then the function only needs the query. All settings are read from the PATROL agent configuration. If a hostname/IP is provided, the optional arguments need to be provided.
- query: WBEM query
Optional arguments:
- namespace: query namespace (Default: “root/cimv2”)
- port: WBEM port (Default: 5989)
- protocol: http or https
- username: the username to use for executing the query
- password: plain text password
WMI
requires MS_HW_q; print(wmi(host, query, namespace, username, password));
This command requires the following arguments:
- host: either the hostID (PATROL ID of the host that will be used to execute the WMI query) or a hostname/IP. If a hostID is provided, then the function only needs the query. All settings will be read from the PATROL agent configuration. If a hostname/IP is provided, the optional arguments need to be provided.
- query: WQL query
Optional arguments:
- namespace: query namespace (default: “root/cimv2”)
- username: the username to use for executing the query
- password: plain text password
Help Commands
List of commands
requires MS_HW_q; print(help());
This command returns a list of all available commands along with a short description and a syntax example.
Getting Additional Product Information
When Hardware Sentry KM starts or after a reinitialization, a report providing the following information is automatically generated:
- Product information (version, build number, release date and release type)
- Product KM list, including version number
- Product PSL Libraries, including file date and size
- Product Binaries, including file date and size
- Connectors, including version number and build date
This information might be required by the Sentry Software Support team when detailed information on your SNMP Walk is necessary for troubleshooting.

By default, only the latest generated report is stored in %PATROL_HOME%\log\ and named MS_HW_product_information_<PATROL Agent port number>.log.
A similar report can be generated by using the productReport() command from the TrueSight Agent Query Tool.