-
Home
- TrueSight
Configure Monitoring Policies
Hardware Sentry KM monitors the hardware of almost any server and external storage device available in datacenters. The configuration procedure will differ whether the server is locally and remotely monitored.
Create a Hardware Policy
Policies enable administrators to deploy configurations on PATROL Agents and monitoring solutions, such as Hardware Sentry KM in an automated way. Policies are designed to define and configure monitoring criteria and apply them to selected PATROL Agents. The configuration criteria are automatically pushed to the PATROL Agents on which the policy is applied.
By default, Solution Administrators have full access to all policies in all realms (tenants). Tenant Administrators have full access to all policies in their realm (tenant). Certain policy management operations can only be performed by the owner of the policy. For more information about the different types of policies, see the Policy management section of the BMC documentation.
To view the Infrastructure Policies page, in the navigation pane of the TrueSight console, expand Configuration and select Infrastructure Policies.
To create a monitoring policy:
-
Log on to the TrueSight console.
-
In the navigation pane, expand Configuration and select Infrastructure Policies.
-
In the Infrastructure Policies page, ensure that the Monitoring tab is selected and click Create Policy.
-
In the Create Monitoring Policy page, specify the monitoring policy properties:
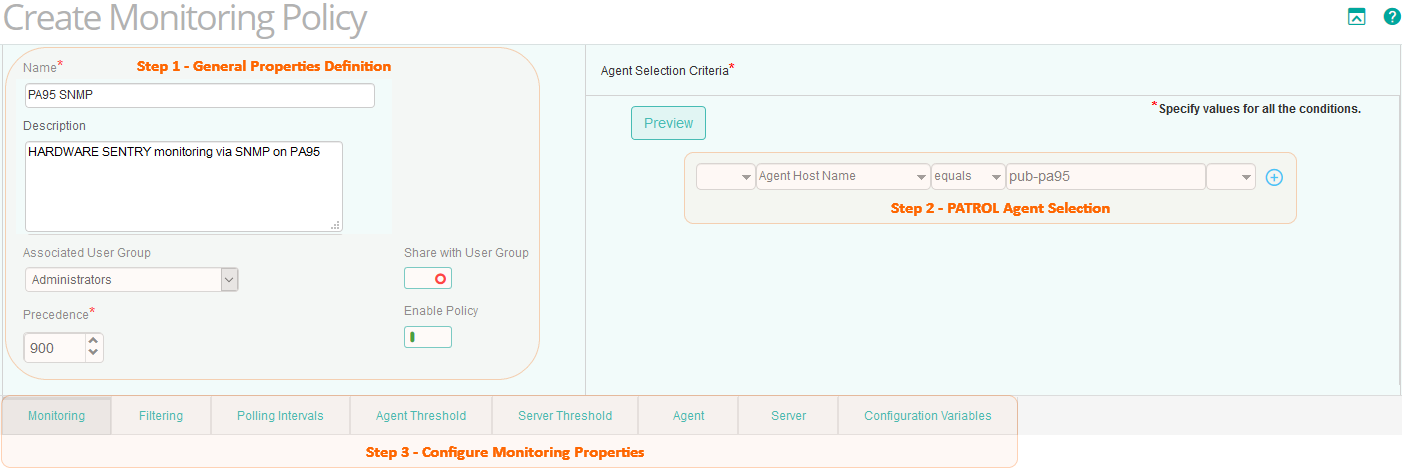

Step 1 - Define the General Properties
| Property | Description |
|---|---|
| Name | Name for the policy. The policy names must be unique. In an environment with tenants, the policy names must be unique for a single tenant. It is a mandatory field. |
| Description | (Optional) A brief description about the policy. |
| Associated User Group | Name of the user group that is associated with the PATROL Agents as defined in the Authorization Profile or in the PATROL Agent ACLs. The policy is applicable to these PATROL Agents. |
| Share with User Group | Specify whether this policy is to be shared with the users across the associated user group or not. This property can be viewed in READ-ONLY mode by other users of the associated user group. Only the owner of the policy can modify this property. |
| Precedence | Priority of the policy. Based on the precedence number that you configure, the configuration is applied to the PATROL Agents and the Infrastructure Management servers. Refer to BMC TrueSight documentation for more information about precedence. |
| Enable Policy | Indicates whether the policy is enabled or disabled. By default, the policy is enabled. If you disable a policy when you create it, the policy configurations are not applied to the PATROL Agents and the Infrastructure Management Servers. If you disable any existing policy, the policy configurations are removed from the PATROL Agents and the Infrastructure Management servers, where the policy was applied. |
Step 2 - Select the PATROL Agents
Define conditions to select the PATROL Agents on which you want to apply the policy:
- Select a property.
- Select an operator to create the condition. The available operators depend on the property that you select.
- Specify a value for the selected property.
- (Optional) To add more than one condition, click the

- (Optional) To group the conditions, use the parentheses and Boolean operators from their corresponding lists.
- Click Save to validate the creation of the policy.

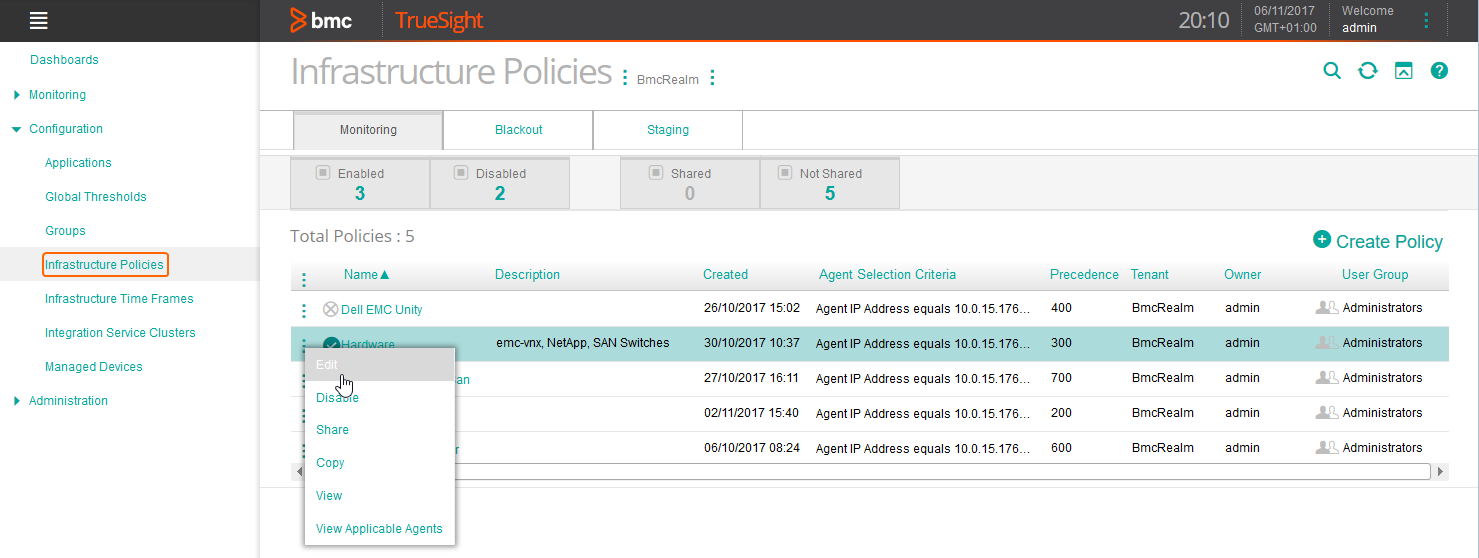
To edit a monitoring policy
- Log on to the TrueSight console.
- In the navigation pane, expand Configuration and select Infrastructure Policies.
- In the Infrastructure Policies page, locate the monitoring policy you wish to modify, click its action button

- In the Edit Monitoring Policy page, locate the monitoring configuration you wish to modify and click its action button
- Customize the configuration.
- Click Save to apply your changes to the selected PATROL Agent(s).

Configure the Hardware Monitor Type Properties
Once the Hardware policy is created and configured, Hardware Sentry KM is loaded by the Agent. Then, the Hardware Monitor Type must be properly configured to start collecting data and reporting on hardware health and performance.
To configure the Hardware Monitor Type:
-
Create a policy or edit an existing policy.
-
Click the Monitoring tab.
-
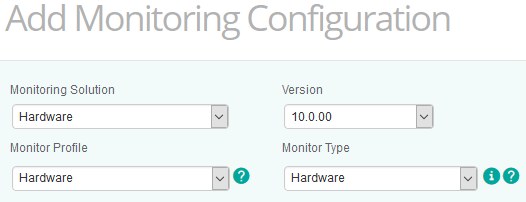
Click Add Monitoring Configuration to configure the Monitor Type properties:
-
From the Monitoring Solution menu, select Hardware.
-
From the Version menu, select the required version. The Monitor Profile and Monitor Type information are automatically selected.
-
Configure the properties for local host or remote host monitoring - To provide required information for identifying the device you wish to monitor, select the appropriate connector and define the device variable information.
-
Configure the discovery and polling intervals (Optional) — To modify the default properties that set the frequency at which discovery and polling processes must be performed.
-
Configure Global Alert Settings (Optional) — To provide all required information to set the alert actions you want the solution to perform when a problem occurs.
-
Manage reporting options (Optional) — To schedule automatic reports on energy usage, Ethernet/fiber port activity and/or hardware inventory.
-
Click Save to apply the new Hardware Monitor Type properties to the selected PATROL Agent(s).

Only the owner of a policy (user who creates the policy) can modify the associated user group and sharing status of a policy. A policy can be modified by only one user at a time and it will be locked for other users. A Solution Administrator can forcibly unlock a policy to modify it. Tenant Administrators can unlock policies within their specific tenants. Users of the associated user group can view, enable, disable, delete, and modify the policy. They cannot modify the associated user group and sharing status of the policy. For detailed information about policy management, refer to the BMC TrueSight documentation.
Configure Hosts monitoring
Configure Local Hosts Monitoring
Hardware Sentry KM is designed to automatically detect the components of the server it is running on along with the PATROL Agent. However, specific properties need to be configured to ensure the product collects and reports data and performance as needed.
-
Click Add Monitoring Configuration to open the device configuration panel and select the options corresponding to the device you wish to monitor.
-
In the Hardware Configuration section, locate List of Devices and click Add to add a new device to your monitoring environment or click the
-
Configure the device properties:
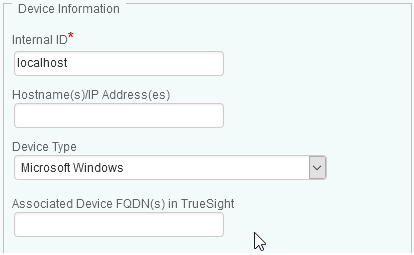
- Indicate the name of the device on which the PATROL Agent is installed and on which the policy will apply or leave the default setting (localhost) to let Hardware Sentry KM identify your local device automatically.
- Enter the Hostname/IP address of the device. If no IP address is provided, the specified device name will be used. The IP address will then be resolved by your DNS/hosts file.
- Select the Device Type.
-
Scroll down to the Protocol/Connection Information section to configure the options specific to the protocol you wish to use for monitoring the device:
-
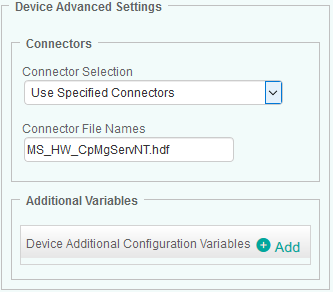
(Optional) Scroll down to the Device Advanced Settings section to select the specific connector(s) that will be used to monitor your device and to define additional configuration variables. See the exhaustive list of available connectors.
-
Select an option from the Connector Selection list:
- Automatic (default and recommended mode): to let the solution automatically run tests at each discovery and select the connector files that most closely match the requirements of the managed system.
- Exclude Specified Connectors: to prevent connector file(s) to be used by the solution. Connector file names must be comma-separated (Example: CpMgServNT, DellOpenManage). See the exhaustive list of available connectors.
- Use Specified Connectors (for advanced users): to manually enter the connector file names the solution will use to monitor the managed system. Please note that Connector file names must be comma-separated (Example: CpMgServNT, DellOpenManage). See the exhaustive list of available connectors.
An error in the connector file selection will prevent Hardware Sentry KM from properly monitoring the managed system. Note that connectors' names are case sensitive.
-
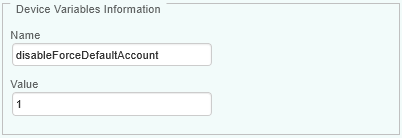
In the Additional Variables section, click Add to configure the device additional configuration variables which will be applied to a single supervised host or device:
-
Enter the Name and Value of the configuration variable(s) you need to configure. Multiple values must be separated by a semi-colon (;). Refer to the Global Advanced Additional Configuration Variables and Host-Specific Configuration Variables sections for a complete list of available variables.
-
-
Click OK to validate.
-
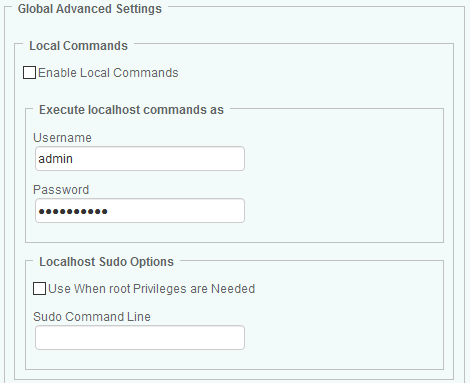
In the Add Monitoring Configuration panel, locate the Global Advanced Settings section and the Local Commands settings options:
-
Select the Enable Local Commands to enable the utilization of local commands.
-
In the Execute localhost OS command as section, specify the user account for executing external commands on the localhost:
-
Executing commands with the default PATROL user account: leave blank to use the default PATROL account credentials
-
Executing commands with a specific user account: enter the username and password of the account you wish to use to execute the commands (typically root credentials).
-
(UNIX/Linux only) Localhost Sudo Options: Allows you to use the Sudo utility to execute root privileged command. If the PATROL Agent default account does not have sufficient privileges to execute commands and cannot be granted super-user rights, use the “sudo” utility to authorize users to execute specific commands as another user account (typically root). To configure Hardware Sentry KM to use Sudo:
- Select the Use When root Privileges are Needed option. Make sure the sudo utility is installed on the system and the
/etc/sudoersfile is configured to allow the PATROL Agent to execute the commands as root. - Configure “sudo” to allow the PATROL Agent default account to execute the needed commands as root (modify the
/etc/sudoersfile). Configuring “sudo” requires root privileges. - Make sure the sudo utility is installed on the system and the
/etc/sudoersfile is configured to allow the PATROL Agent to execute the commands as root. - Verify that the PATROL Agent default account is properly authorized to execute the needed commands through the “sudo” utility.
- Select the Use When root Privileges are Needed option. Make sure the sudo utility is installed on the system and the
-
In Sudo Command Line, enter the command line you wish Hardware Sentry KM to execute.
-
-
Click OK to save your settings. After a few minutes, your device will be displayed in the TrueSight console.


To edit the local host settings
- From the Infrastructure Policies panel, click the Monitoring tab and then click the
- In the List of Devices section, click the
- In the configuration panel, modify the connection information.
- Click OK twice.
- The new settings will be automatically applied to the localhost.
Configure Remote Hosts Monitoring
Hardware Sentry KM allows you to configure remote monitoring for any accessible device to get a real-time insight of the health of your monitored environment, perform proactive maintenance operations, and maintain the highest level of performance you need.
Hardware Sentry KM offers the possibility to add remote hosts to your monitoring environment individually or in a batch when the hosts share the same configuration settings (OS, protocol, credentials, etc.). When creating a group of hosts you are proposed to define the group name (Internal ID) as well as the set of hosts included into a group being created. The name (Internal ID) makes it easier for you to identify the hosts that are part of a group in the TrueSight console. Additionally, you can associate your system to Fully Qualified Domain Names (FDQNs) of specific devices in TrueSight when you define the connection settings of your host(s). The FDQN designates the specific location of a device within the Domain Name System (DNS) hierarchy; it communicates the host’s position relative to the root of the DNS namespace. An FQDN enables each connected device to be uniquely identified and located within the monitored environment and therefore ensures that a device is properly identified.
Adding a remote host or an external device to your monitored environment consists in identifying the host/device you wish to monitor and configure the connection settings according to the protocol you need to use. This section provides step-by-step instructions for adding a single host/device or for adding multiple hosts/devices at a time, that will be easily identified as part of a group in the TrueSight console.
To add the monitoring of remote hosts
-
Click Add Monitoring Configuration to open the device configuration panel and select the options corresponding to the device you wish to monitor.
-
In the Hardware Configuration section, locate List of Devices and click Add to add a new device to your monitoring environment or click the
-
Configure the device properties:
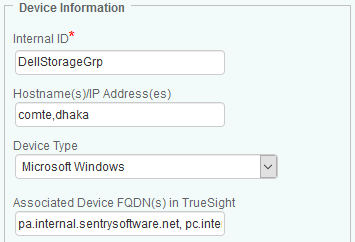
- Internal ID: Enter an ID that will identify the remote host or that will be used as a group name if you wish to configure several hosts that share the same connection settings (OS, protocol, credentials, etc.).
- Hostname(s) or IP address(es): Enter the Hostnames or IP addresses of the hosts you wish to monitor. A group can contain multiple hostnames/IP addresses that must be separated by commas. Alternatively, you can use an external file that contains a list of the hosts you want to monitor. The file path must be entered in the Hostname(s) or IP address(es) field, prefixed
@(example:@C:\myHostFileList.txt) and the file must follow this format:
<hostname/IP>;<FQDN> <hostname/IP 2>;<FQDN 2>- From the drop-down list, select the System or Device type.
- (Optional) Enter the FQDN to associate the system to another device in TrueSight. The FQDN uniquely distinguishes a device from any other system and ensures that a device monitored via their management cards or through controllers, for example, is properly identified.
-
Scroll down to the Protocol/Connection Information section to configure the options specific to the protocol you wish to use for monitoring the device:
-
(Optional) Scroll down to the Device Advanced Settings section to select the specific connector(s) that will be used to monitor your device and to define additional configuration variables. See the exhaustive list of available connectors.
-
Select an option from the Connector Selection list:
- Automatic (default and recommended mode): to let the solution automatically run tests at each discovery and select the connector files that most closely match the requirements of the managed system.
- Exclude Specified Connectors: to prevent connector file(s) to be used by the solution. Connector file names must be comma-separated (Example: CPMgServNT, DellOpenManage). See the exhaustive list of available connectors.
- Use Specified Connectors (for advanced users): to manually enter the connector file names the solution will use to monitor the managed system. Connector file names must be comma-separated (Example: CPMgServNT, DellOpenManage). See the exhaustive list of available connectors.
An error in the connector file selection will prevent Hardware Sentry KM from properly monitoring the managed system. Note that connectors' names are case sensitive.
-
In the Additional Variables section, click Add to configure the device additional configuration variables which will be applied to a single supervised host or device:
- Enter the Name and Value of the configuration variable(s) you need to configure. Multiple values must be separated by a semi-colon (;). Refer to the Global Advanced Additional Configuration Variables and Host-Specific Configuration Variables sections for a complete list of available variables.
-
-
Click OK to save your settings. After a few minutes, your device will be displayed in the TrueSight console.

To edit the remote host settings
If you change the monitoring settings for hosts that are part of a group, make sure that these settings apply to all the hosts in the group. Once saved, the new configuration (policy) will automatically be applied to all the hosts in the group.
- From the Infrastructure Policies panel, click the Monitoring tab and then click the
- In the List of Devices section, click the
- In the device configuration panel, modify the connection information.
- Click OK twice.
- The new settings will be automatically applied to the specified host(s)/device(s).
Configure the Display of Monitored Hosts
The way hosts are displayed in your monitoring environment can be customized to help you organize your monitoring environment and facilitate the identification of your monitored systems.
To customize the hosts display
-
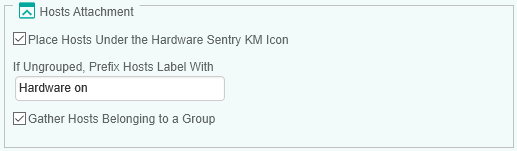
In the Add Monitoring Configuration, scroll down to the Hosts Attachment in the Global Advanced Settings section.
-
Configure the following properties:

| Property | Description | Default |
|---|---|---|
| Place hosts under the Hardware Sentry KM icon | To display all hosts or groups of hosts directly under the Hardware Sentry icon. If unselected, hosts or groups of hosts will automatically displayed under the PATROL Agent. | Unselected |
| If Hosts are placed directly under the PATROL Agent, prefix hosts label with | To add a string that will prefix all hosts name in the PATROL console. Leave blank to display the hosts or groups of hosts with their respective names. | Default is Hardware on |
| Gather hosts belonging to a group under a container | To group the hosts in a container. | Unselected |
Configure Monitoring Protocols Settings
Before configuring the monitoring protocols, refer to the Connectors Full Listing page.
Using the HTTP Protocol
You can use the HTTP protocol to establish a connection with the HTTP/REST interface and monitor systems or devices.
To monitor a system using the HTTP protocol:
-
In the List of Devices panel, scroll down to the Protocol/Connection Information section to define the HTTP options.
-
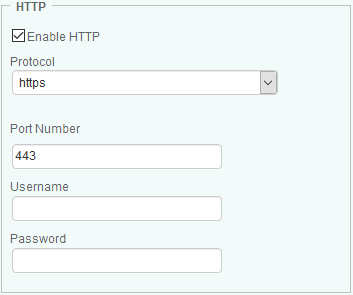
Select the Enable HTTP option to enable the utilization of the HTTP protocol.
-
Configure the HTTP connection settings:
- the protocol you wish to use: HTTP or HTTPS. By default, Hardware Sentry KM proposes to use HTTPS.
- The port number to be used. By default, Hardware Sentry KM proposes to use port 443.
- the HTTP credentials (username and password).
-
Click OK to validate.

Using the SNMP Protocol
Hardware Sentry KM can leverage the SNMP protocol to collect hardware information. In that case, an SNMP agent must be installed on the monitored host and the SNMP connection configured. The information required by Hardware Sentry KM depends on to the SNMP version you wish to use.
To monitor a server using the SNMP protocol:
-
In the List of Devices panel, scroll down to the Protocol/Connection Information section.
-
Select the Enable SNMP option to enable the utilization of the SNMP protocol.
-
Define the SNMP Information:
- Select the version of the SNMP protocol that Hardware Sentry KM must use to retrieve information from the SNMP agent. Possible values are 1, 2c, or 3.
- Indicate the SNMP port number you wish to use to perform SNMP queries. By default the SNMP queries are performed through port 161.
- Define the connection settings according to the SNMP protocol you wish to use:
- If you wish to use SNMP version 1, provide a valid SNMP Community string to use to perform SNMP v1 queries (Default: Public). Please note that timeout is set through the PATROL Agent Configuration variable
/snmp/default_timeout. - If you wish to use SNMP version 2c:
- provide a valid SNMP Community string to use to perform SNMP v2c queries (Default: Public).
- indicate the number of seconds Hardware Sentry KM will wait for an SNMP response. By default, the timeout is set to 120 seconds to cover all the sub-queries that compose the ‘parent’ queries.
- If you wish to use SNMP version 3:
- enter the Username to be used to perform the SNMP v3 queries.
- select the Authentication Protocol to be used to authenticate the SNMP v3 messages. Possible values are: None, MD5, SHA, SHA-224, SHA-256, SHA-384, SHA-512.
- provide the Authentication Password to be used to authenticate the SNMP v3 messages.
- select the Privacy Protocol to be used to authenticate SNMP v3 messages. Possible values are: None, AES-128, AES-192 AES-256, DES.
- enter the Privacy Password associated with the privacy protocol.
- enter the Context Name accessible to the SNMP entity.
- indicate the number of seconds (Timeout) Hardware Sentry KM will wait for an SNMP response. By default, the timeout is set to 120 seconds to cover all the sub-queries that compose the ‘parent’ queries.
- If you wish to use SNMP version 1, provide a valid SNMP Community string to use to perform SNMP v1 queries (Default: Public). Please note that timeout is set through the PATROL Agent Configuration variable
Using the SSH Protocol
SSH (Secure Shell) can be used to monitor Linux/UNIX servers or to communicate remotely with systems and devices that have an SSH interface on their management card. Once the SSH options are configured, Hardware Sentry KM will run commands to determine the status, performance or capacity of these systems.
To monitor a server using the SSH protocol
-
In the List of Devices panel, scroll down to the Protocol/Connection Information section to define the SSH options.
-
Select the Enable SSH option to enable the utilization of the SSH protocol.
-
Provide the required SSH configuration information:
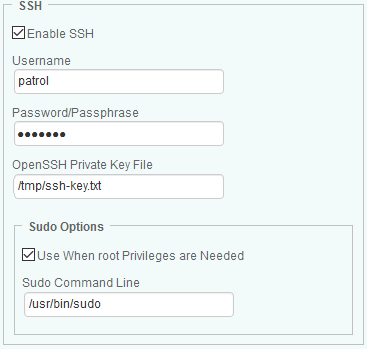
- Provide the Username, Password/Passphrase (if required), and the OpenSSH Private Key File.
The key file must be accessible to the PATROL Agent that will make the connection to the host through the SSH protocol.
- (UNIX/Linux only) In the Sudo Options section:
- Check the Use When root Privileges are Needed option to use the “sudo” utility in order to execute external commands as “root” on UNIX/Linux platforms.
- Enter the Sudo Command Line to execute.
-
Click OK to validate.

Using the WBEM Protocol
You can use the WBEM (Web-Based Enterprise Management) protocol to communicate directly with a SMI-S Provider and collect information.
To monitor a server using the WBEM protocol:
-
In the List of Devices panel, scroll down to the Protocol/Connection Information section to define the WBEM options.
-
Select the Enable WBEM option to enable the utilization of the WBEM protocol.
-
Provide the required WBEM configuration information:
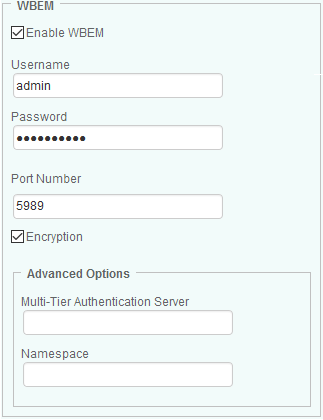
- Enter the Username and Password to use to establish the connection with the device using the WBEM protocol. If no credentials are provided, Hardware Sentry KM will use the PATROL Agent default account on localhost.
- Specify the Port Number. By default port 5989 is used for encrypted connections and 5988 for non-encrypted connections.
- For encrypted connections, check the Encryption option.
- In the Advanced Options section:
- Enter the IP address/device name of the Multi-Tier Authentication Server. This option is mostly used for VMware servers. If left blank, the solution will automatically use the WBEM credentials.
- Enter the WBEM Namespace. Leave blank to let the solution detect the proper namespace (recommended).
-
Click OK to validate.

Using the WMI Protocol
You can use the WMI (Windows Management Instrumentation) protocol to communicate directly with a SMI-S Provider/storage system and collect information from systems or devices.
To monitor a server using the WMI protocol:
-
In the List of Devices panel, scroll down to the Protocol/Connection Information section to define the WMI options.
-
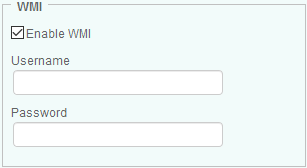
Select the Enable WMI option to enable the utilization of the WMI protocol.
-
Enter the Username and Password to use to establish the connection with the device through the WMI protocol. If no credentials are provided, Hardware Sentry KM will use the PATROL Agent default account on localhost.
-
Click OK to validate.

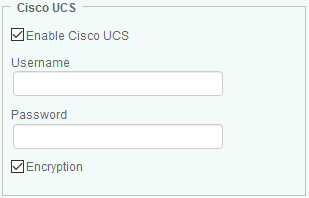
Using the Cisco UCS Manager
To collect information about Cisco UCS Blade Chassis and Cisco Fabric Interconnect Switch, you need to provide the required credentials for Cisco UCS (Unified Computing System) Manager.
To monitor a server using the Cisco UCS Manager:
-
In the List of Devices panel, scroll down to the Protocol/Connection Information section to define the Cisco UCS Manager options.
-
Select the Enable Cisco UCS option to enable the utilization of the Cisco UCS protocol.
-
Enter the Username and Password to use to establish the connection with the Cisco UCS.
-
Uncheck the Encryption option to disable the SSL Encryption for UCS login (HTTPS). By default, the encryption is enabled.
-
Click OK to validate.

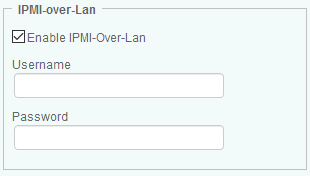
Using the IPMI-Over-LAN Protocol
IPMI-Over-LAN is the out-of-band interface used by Hardware Sentry KM to bypass the usual hardware agents and communicate directly with the motherboard’s BMC chip.
To monitor a server using the IPMI-Over-LAN protocol:
-
In the List of Devices panel, scroll down to the Protocol/Connection Information section to define the IPMI-Over-LAN options.
-
Select the Enable IPMI-Over-Lan option to enable the utilization of the IPMI-Over-LAN protocol.
-
Enter the Username and Password to use to establish the connection with the IPMI chip out-of-band (IPMI-over-LAN).
-
Click OK to validate.

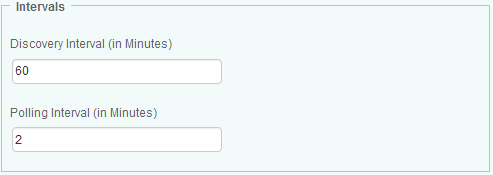
Configure the Discovery and Polling Intervals
Hardware Sentry KM periodically performs discoveries to detect new components in your monitored environment. By default, the solution runs a discovery every hour, but you can customize this interval to match your specific needs.
Hardware Sentry KM also polls the managed systems to collect hardware health data. By default, the polling interval for this “data-collect” is set to every 2 minutes.
To configure the discovery and polling intervals:
-
In the Add Monitoring Configuration panel, scroll down to the Intervals section.
-
Enter the frequency (in minutes) of the discovery process. By default, the discovery interval is set to 60 minutes
-
Enter the interval at which the solution must poll the managed systems to collect hardware health data. By default, the polling interval is set to 2 minutes
-
Click OK to save your settings.

Configure Thresholds
By default no global thresholds are set in TrueSight. To take full advantage of Hardware Sentry KM, Sentry Software recommends setting thresholds as specified in the Reference Guide.
Three type of thresholds exist in TrueSight:
- Global thresholds: Infrastructure Management Server-side thresholds (Absolute, Signature and Abnormality) managed from the TrueSight console, applicable to all monitors in a realm.
- Agent thresholds: “Classic” range-based thresholds defined on the BMC PATROL Agents. They can be set at the monitor type or monitor instance level.
- Server thresholds: Same as global thresholds, but defined in a monitoring policy and therefore applicable to a subset of agents. Such thresholds can be set at the monitor type or monitor instance level.
PATROL events generated by the Sentry Software’s KMs provide more information about the failure. Sentry Software therefore recommends setting agent thresholds over global or server thresholds.
Setting Global Thresholds
Hardware Sentry KM includes predefined thresholds that can be imported into TrueSight Operations Management.
IMPORTANT: Although Sentry Software recommends using these predefined thresholds, it is often a good practice to review the threshold template before importing it in TrueSight to ensure that predefined thresholds meet your requirements.
To import predefined thresholds:
-
Download the MS_HW_thresholdtemplate.csv file.
-
Review the content of the MS_HW_thresholdtemplate.csv and possibly update it.
-
Copy the content of the MS_HW_thresholdtemplate.csv file to the thresholdtemplate.csv file located in
_<TrueSight Presentation Server installation directory>_\TrueSightPServer\truesightpserver\modules\cmaon your TrueSight server. -
If required, in the resulting thresholdtemplate.csv file, replace bmcrealm with the name of the tenant (from version 11 of TrueSight Operations Management, you can use * to apply these thresholds to all tenants).
-
From a command-line interface, go to
_<TrueSight Presentation Server installation directory>_\TrueSightPServer\truesightpserver\binand execute the command below:tssh.bat thresholdtemplate import +-------------------------------------------------------------------------------------------+ | BMC TrueSight Presentation Server - Command Line Interface 2017 version 11.0 | | Copyright 2014-2017. BMC Software, Inc. as an unpublished work. All rights reserved. | +-------------------------------------------------------------------------------------------+ Importing thresholds template.... Importing thresholds from file "C:/Program Files/BMC Software/TrueSightPServer/truesightpserver\modules\cma\thresholdtemplate.csv" Successfully imported thresholds template
You can further customize these global thresholds to apply specific settings to each attribute of every Monitor Types.
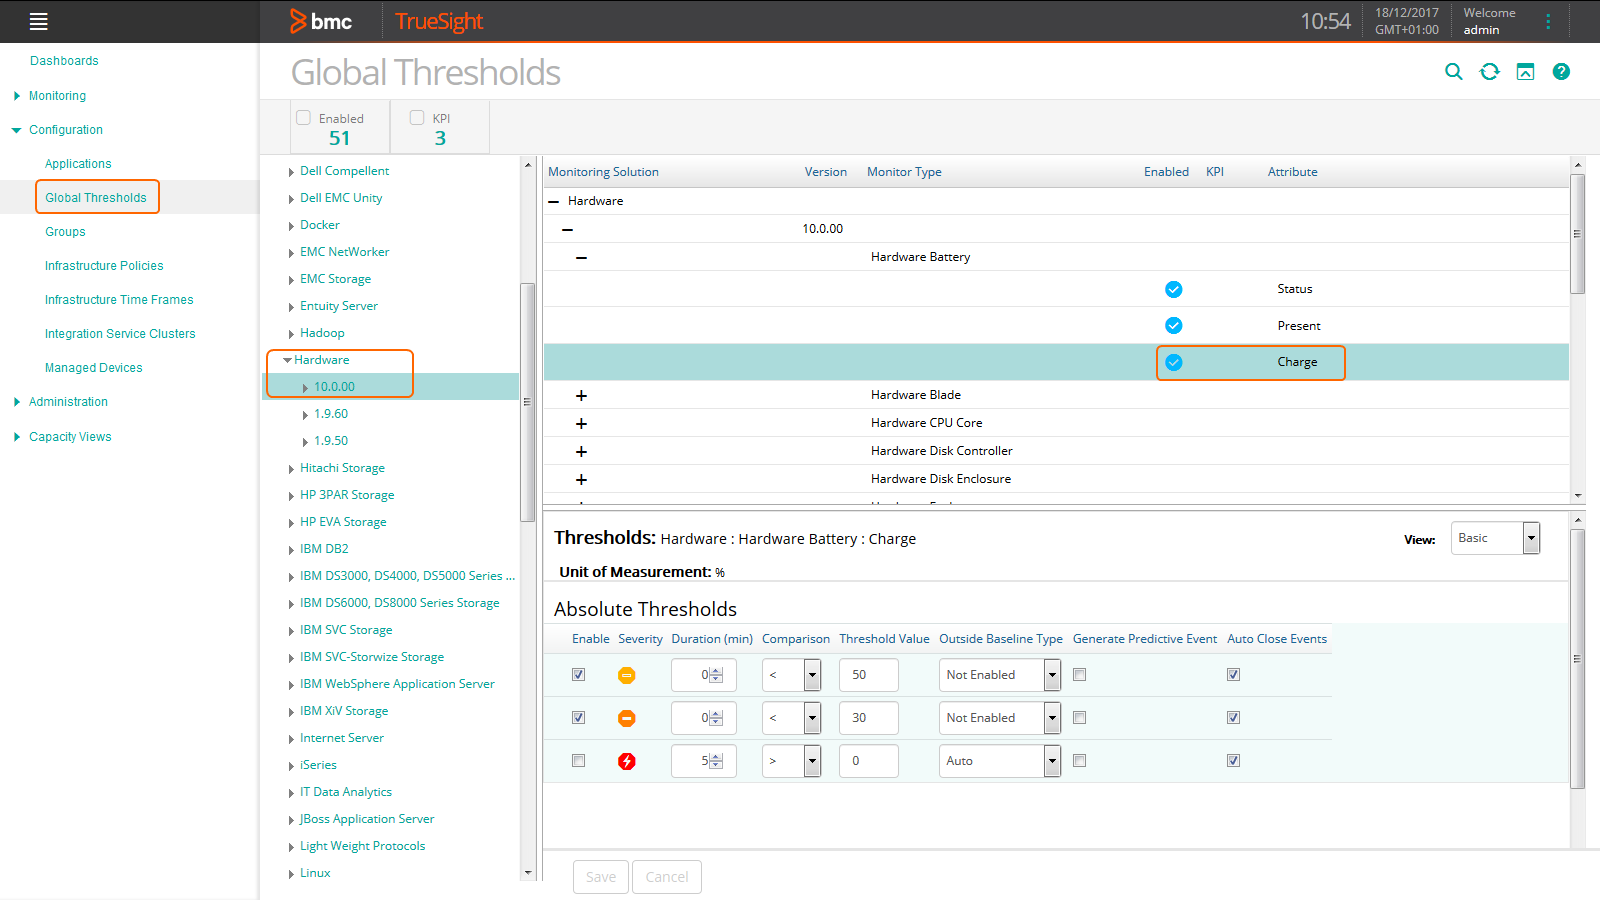
To customize global thresholds
-
Log on to the TrueSight console.
-
In the navigation pane, expand Configuration and select Global Thresholds.
-
Expand Hardware and select the required version. All the monitors and attributes are displayed on the right pane.
-
Select the attribute for which you wish to set global thresholds.
-
In the bottom pane, specify under which conditions events will be triggered. In our example, the threshold for the Charge Monitor Type is set to trigger an event of severity “Minor” when Charge attribute is lower than 50% and an event of severity “Major” when it is lower than 30%.


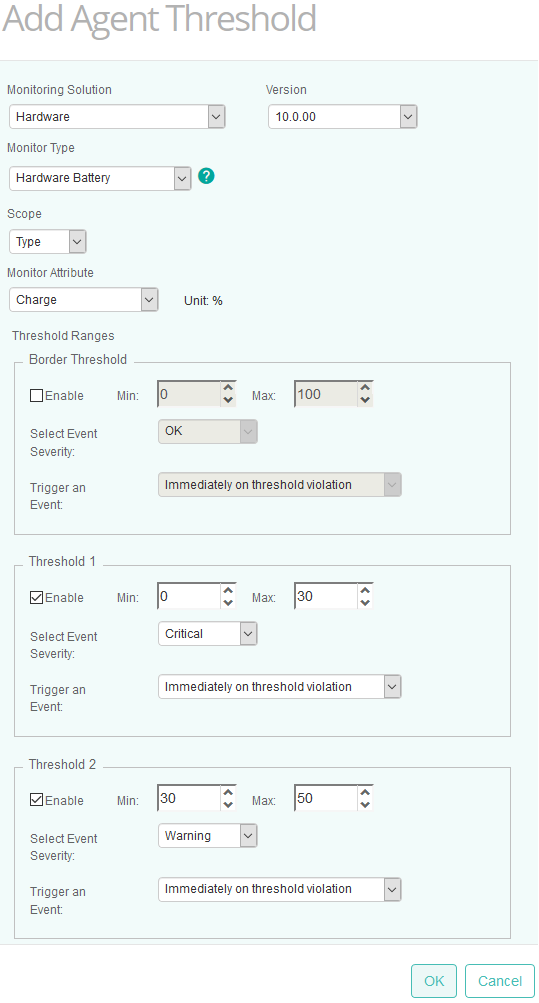
Setting Agent Thresholds
Agent thresholds are range-based thresholds defined on the BMC PATROL Agents. You can define range-based thresholds for the attributes of a Monitor Type (all monitor instances) or a single monitor instance on the PATROL Agents.
To set Agent thresholds:
-
Log on to the TrueSight console.
-
Edit your Hardware monitoring policy:
-
Select the Agent Thresholds tab and click Add Agent Threshold.
-
Select Hardware as the Monitoring Solution, the Version, the Monitor Type, the Scope and the Monitor Attribute.
-
The Instance SID is required when setting thresholds at the instance level. You will find that information in the TrueSight Infrastructure Management console by placing the cursor on the required instance.
-
Specify under which conditions events will be triggered.
-
Click OK.
-
Click Save.


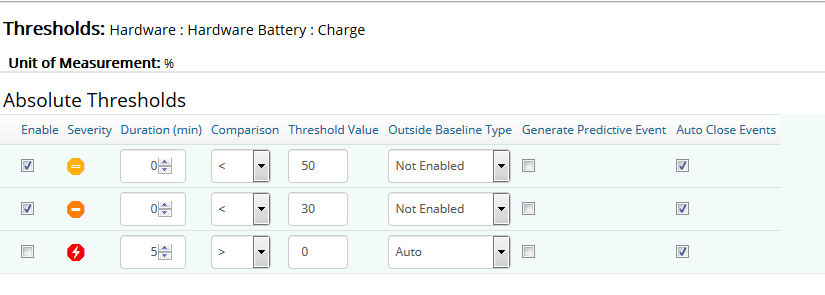
Setting Server Thresholds
Server thresholds configured for a specific policy override the global thresholds set in the TrueSight console.
-
Log on to the TrueSight console.
-
Edit your Hardware monitoring policy:
-
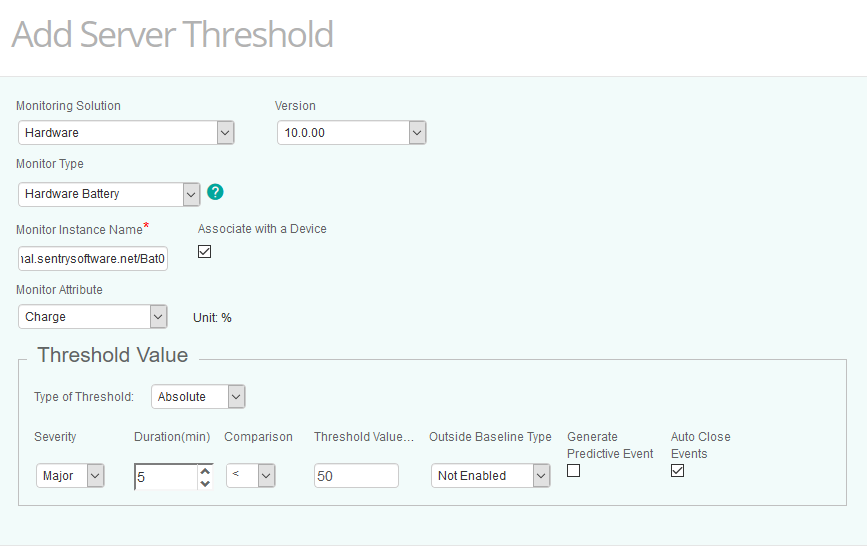
Select the Server Threshold tab and click Add Server Threshold.
-
Select the Monitoring Solution (Hardware), the Version and the Monitor Type.
-
Enter the Monitor Instance Name and select the Monitor Attribute.
-
Select the Type of Threshold: Absolute, Signature, or Abnormality.
-
Specify under which conditions events will be triggered. For example, define an event of severity “Major” when the Charge attribute of the specified battery reaches 50% for more than 5 minutes.
-
Click OK.
-
Click Save.

Configure Global Alert Settings
Configuring Global Alert Settings consists in indicating:
- the specific actions to be executed when a hardware failure is detected.
- the number of consecutive times an attribute has to stay above (or below) the threshold for an alert to be triggered.
- the delay after which Error Count attributes should be reset.
- when missing devices should be deleted.
- the action to perform when the solution returns a Failed Connector status on an instance.
- the action to perform when the solution returns an Unknown Status on a device.
In large environments, we recommend setting the Global Alert Settings through a specific policy. You can then apply this policy, which defines global alert settings but does not contain any device monitoring configuration, to all Agents at once.
Configuring Alert Actions
Alert Actions enable the administrator to choose specific actions to be executed when a hardware failure is detected. With Alert Actions, it is possible to customize the way a hardware problem notification is performed.
Hardware Sentry KM can be configured to run one, several, or all types of Alert Actions when an alert is triggered regarding the monitored hardware.
To set the alert actions you want the solution to perform when a problem occurs:
-
In the Add Monitoring Configuration, scroll down to the Global Alert Settings section.
-
Define the alert action you wish Hardware Sentry KM to perform Upon a Hardware Problem and Upon a Connector Failure:
- A Specific PATROL Event (Default)
- A STD 41 PATROL Event
- No Event
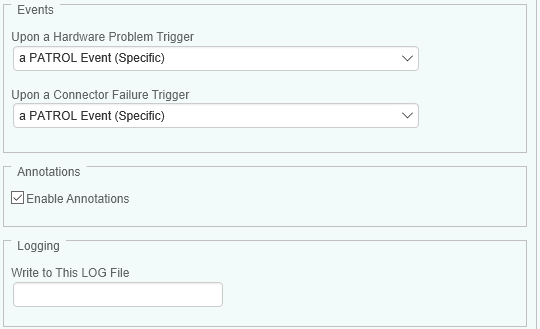
A Hardware Health Report is automatically generated when a PATROL Event occurs to provide detailed information about the system impacted by the hardware failure or the threshold breach (ex: device type and label, serial number, etc.).
-
The Enable Annotations option makes the solution annotate the parameter’s graph with a comprehensive report of the problem. Annotations are enabled by default. Uncheck the option if you do not want graphs to be annotated.
-
The Write to This LOG File option enables you to enter the path of a log file where Hardware Sentry KM will write information about the problem.
-
Click OK to save your settings.

Configuring Alert Delay
Configuring the alert delay consists in indicating the number of consecutive times an attribute has to stay above (or below) the parameter threshold for an alert to be triggered. Setting alert delays can prevent false alerts to be triggered.
To configure the alert delay:
-
In the Add Monitoring Configuration panel, scroll down to the Alert Delay section.
-
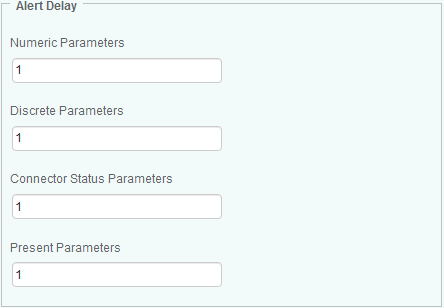
For each parameter type, indicate the number of consecutive times parameters have to stay above or below the defined threshold before an alert is triggered:
- Numeric parameters (e.g.: Error Count parameters)
- Discrete parameters (e.g.: Predicted Failure, Need Cleaning, Status, etc.)
- Connector status parameters
- Present parameters
-
Click OK to save your settings

Automatically Resetting Error Count Parameters
Error Count parameters keep increasing as new errors are encountered. To reset these parameters, you can configure Hardware Sentry KM to automatically acknowledge an alert on the Error Count parameters and reset it to zero after a specified period of time.
To automatically reset Error Count parameters:
-
In the Add Monitoring Configuration panel, scroll down to the Auto Reset section.
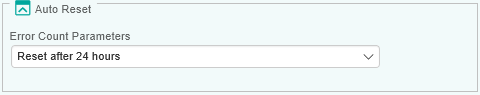
-
From the Error Count Parameters list, select the period of time after which you want the solution to automatically reset the Error Count parameters.
-
Click OK to save your settings.

Hardware Sentry KM will automatically apply the specified settings to the Error Count parameter of the following Monitor Types:
- Hardware Logical Disk
- Hardware Memory Module
- Hardware Physical Disk
- Hardware Processor
- Hardware Robotics
- Hardware Tape Drive
Enabling/Disabling the Missing Device Detection
Enabled by default, the missing device detection mechanism alerts operators when a device that was previously detected in the system is no longer found. If a device is no longer discovered, its Present attribute goes into alarm.
This mechanism is very useful when, for example, a non-redundant physical disk does not restart upon a system reboot and is therefore no longer seen by the operating system and the monitoring software.
The missing device detection feature does not apply to logical disks, voltage and temperature sensors, LEDs, and LUNs.
To disable the missing device detection:
-
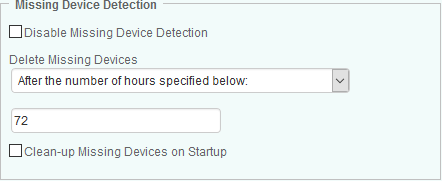
In the Add Monitoring Configuration panel, scroll down to the Missing Device Detection section.
-
Disable Missing Device Detection: Check this box if you no longer want to be alerted when a device goes missing. Deactivating this feature when some missing devices have already been detected will trigger a removal of these devices from the monitoring environment.
-
Delete missing devices: if the “Disable Missing Device Detection” box is unchecked, specify when the missing devices should be deleted:
- After the number of hours specified below: devices will be removed when the specified time is reached. Enter the desired time in the text field (default: 72).
- Never: devices will continue to appear in the console even when they are detected as missing.
- Immediately: devices will be removed from the console as soon as they are detected as missing. An alert will however be triggered before deletion.
The history of devices that have been removed will be lost.
-
Clean-up Missing Devices on Startup: Select this option if Hardware Sentry KM triggers false “Missing Device” alerts after a start up (reboot) operation. Occasionally, servers reassign IDs to some devices during start up (reboot). When this situation occurs, Hardware Sentry KM cannot match these devices with their new IDs and irrelevant alerts are triggered. This option configures the solution to automatically clean-up the list of previously discovered devices when the Agent starts.
Devices that went missing during the start up (reboot) operation will not be reported as missing.
-
Click OK to save your settings.

Managing Connector Failure
By default, the monitored object instances marked as “Failed Connector” with an OFFLINE status are deleted from the monitored environment after a KM reinitialization or a forced rediscover of the host. However, you can set the solution to automatically clear their associated Monitors after a period of time, if the device is no longer reachable (eg, credentials change, or system is offline)
To customize the KM behavior on connector failures:
-
In the Add Monitoring Configuration panel, scroll down to the Connector Failure section.
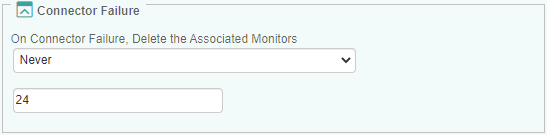
-
On Connector Failure, Delete the Associated Monitors: Select an option:
- Never (Default)
- Immediately
- After the number of hours specified below: Enter the number of hours after which Monitors associated to a Failed Connector instance will be deleted. (Default: 24 hours).
-
Click OK to save your settings.

Configuring the Unknown Status
On rare occasions, Hardware Sentry KM collects an unexpected value for a monitored device and returns the poll with “Unknown Status”. If this situation occurs, you can configure Hardware Sentry KM to perform specific actions.
To configure the Unknown Status:
-
In the Add Monitoring Configuration panel, scroll down to the Unknown Status section.
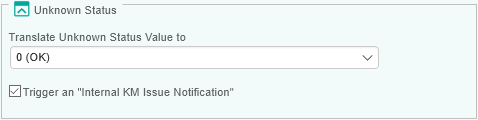
-
From the Translate Unknown Status Value to list, select the status you wish to apply:
- Nothing to keep the Status attribute value as Unknown
- 0 (OK) to set the Status attribute to OK (default)
- 1 (Warning) to trigger a WARNING on the Status attribute
- 2 (Alarm) to trigger an ALARM on the Status attribute.
-
Trigger an Internal KM Issue Notification: By default, Hardware Sentry KM triggers an Internal KM Issue Notification when an unknown status is collected. Un-select this option to disable the notification.
-
Click OK to save your settings.
