-
Home
- Standalone with Monitoring Studio
Access the Web Interface
This chapter explains how to access the Hardware Sentry KM Web UI via Monitoring Studio and outlines the main functionalities that will help you set up your hardware monitoring environment.
Hardware Sentry KM can be configured and used via the Monitoring Studio Web interface. This interactive Web console also facilitates live interaction with the PATROL Agent and provides a user-friendly environment to manage specific configuration operations.
- Get the required installation packages from the Sentry Software Website:
-
Hardware Sentry KM
-
Monitoring Studio X
-
Java. JRE version 17 or higher is required to run Hardware Sentry KM v20.
-
Install the KMs and the JRE on the same server that runs the PATROL Agent:
-
Once the KMs are properly installed, you can access the Web console to configure your Hardware Sentry KM monitoring environment.
Enter the following URL in your Web browser: https://<patrol-agent>:<patrol-agent-port+262>/
Where: <patrol-agent> is the name of the host on which the PATROL Agent runs
and <patrol-agent-port+262> is the number you obtain when you add 262 to the PATROL Agent port number. This is the port number used by default by Monitoring Studio X.
For example, if your PATROL Agent is named <MyPatrolAgent> and the PATROL Agent Port is 3181, the URL to access the Monitoring Studio X Web interface is: https://MyPatrolAgent:3443/.
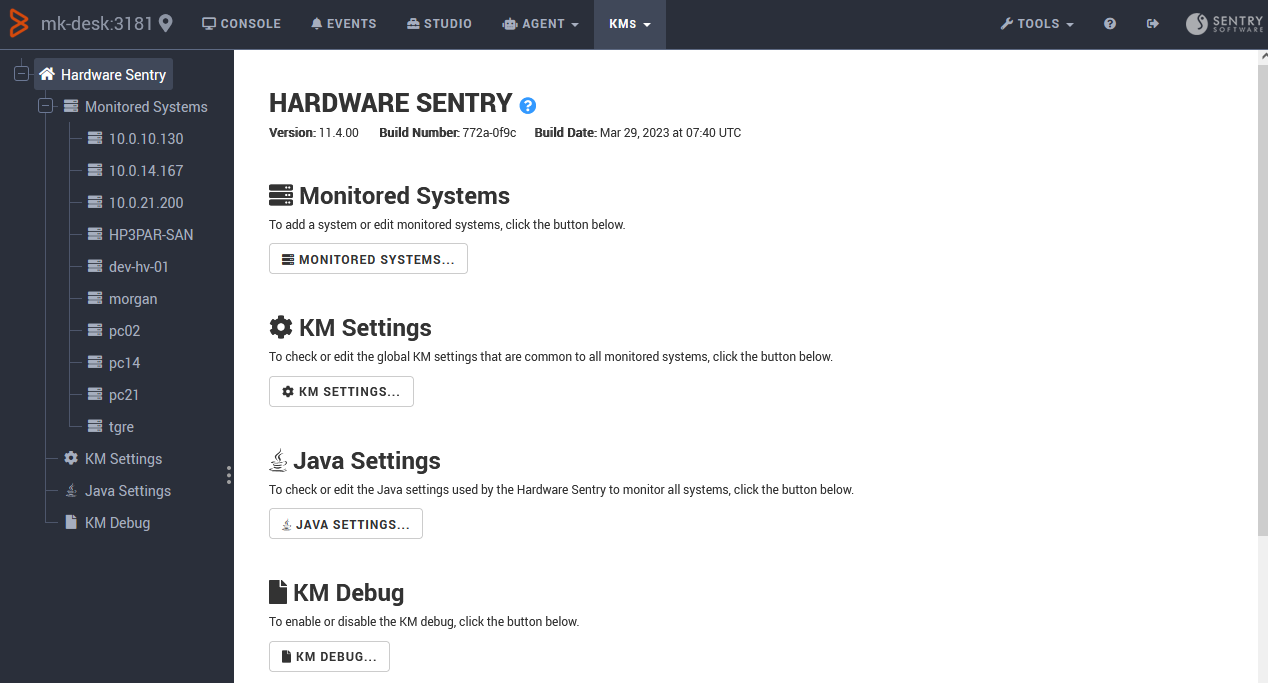
To access the Hardware Sentry KM configuration page, from the Web console, click the KMs menu and select Hardware Sentry KM.

The Hardware Sentry KM home page is an entry point to all the features needed to add any supported endpoints to your monitoring environment and set up their configuration properties. This page also provides access to the KM, the Java and the Debug setting pages.
Additionally, the Console page of the Web Interface displays all the endpoints and their related components discovered by one PATROL Agent, including their status. Additional information is also available when a specific instance or component is selected.
Make sure that the KM operates in Classic mode.