-
Home
- TrueSight
Operate in TSPS
This section describes common hardware monitoring operations that can be performed with the Hardware Sentry KM and its TSPS Component.
Monitoring Hardware Devices
Monitoring hardware devices is essential to system administrators, as it provides full visibility into physical servers health and triggers alarms when a problem occurs. Hardware Sentry KM discovers all the hardware devices (servers) within your monitored environment and leverages the capabilities of the TSPS Component to display a comprehensive list of your systems under the Hardware Devices page of the TSPS console. The TSPS Component extends the range of information reported within the TrueSight standard view with additional information, such as power consumption and server temperature data.
-
Login to your TrueSight console.
-
Select Monitoring > Hardware Devices from the navigation pane.
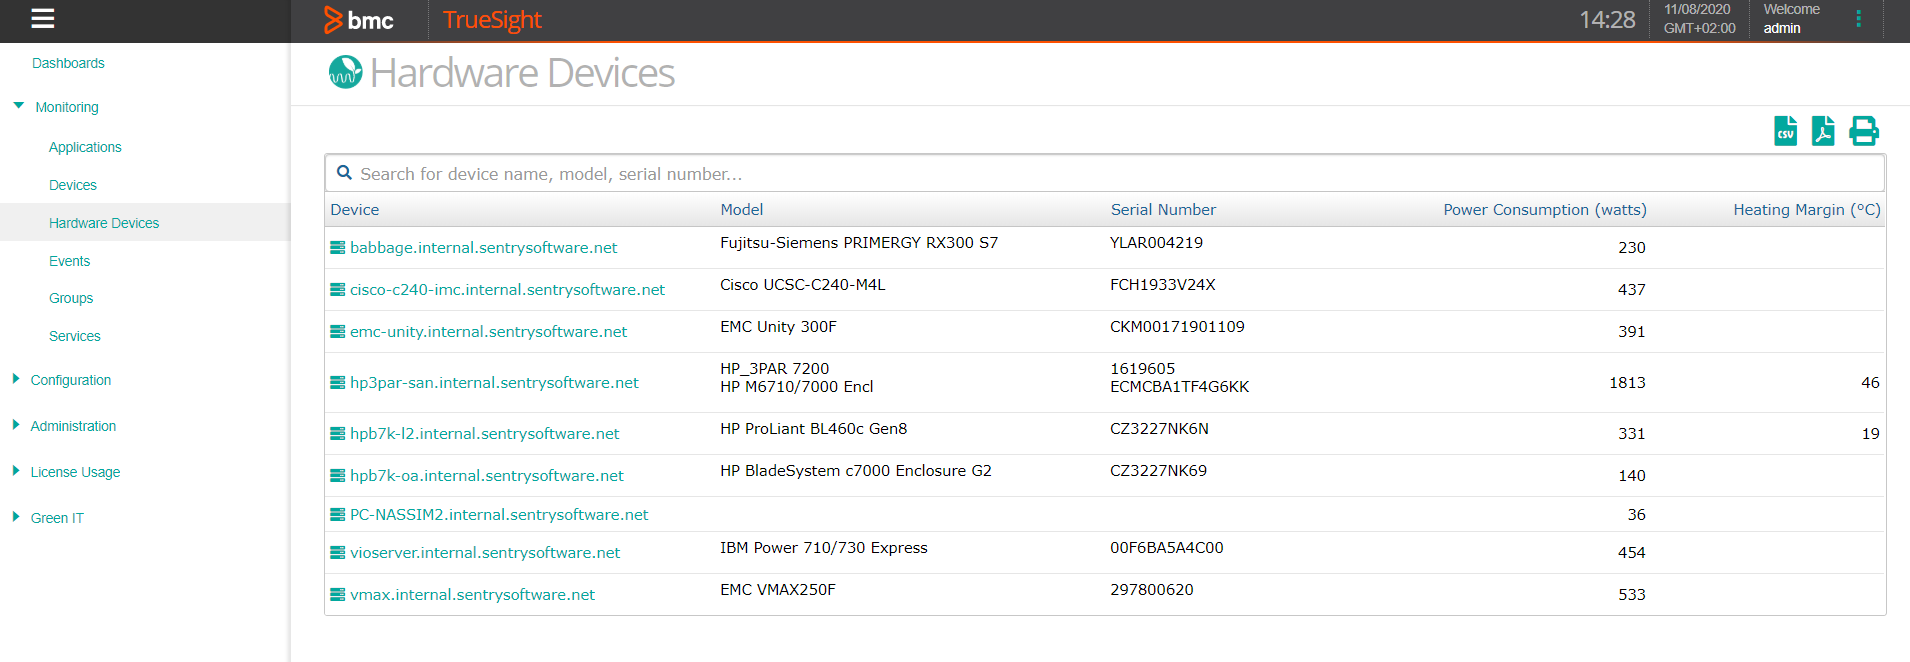 Tip: use the Search to retrieve devices by name, model or serial number.
 -
Browse the list to locate a specific device or search for it by hostname, vendor, model or serial number.
-
Click a device to display a detailed view of its configuration, its associated monitors and events. Two additional tabs, Power and Cooling, provide respectively the power consumption and energy usage readings, and the heating margin and temperature levels for the selected device.
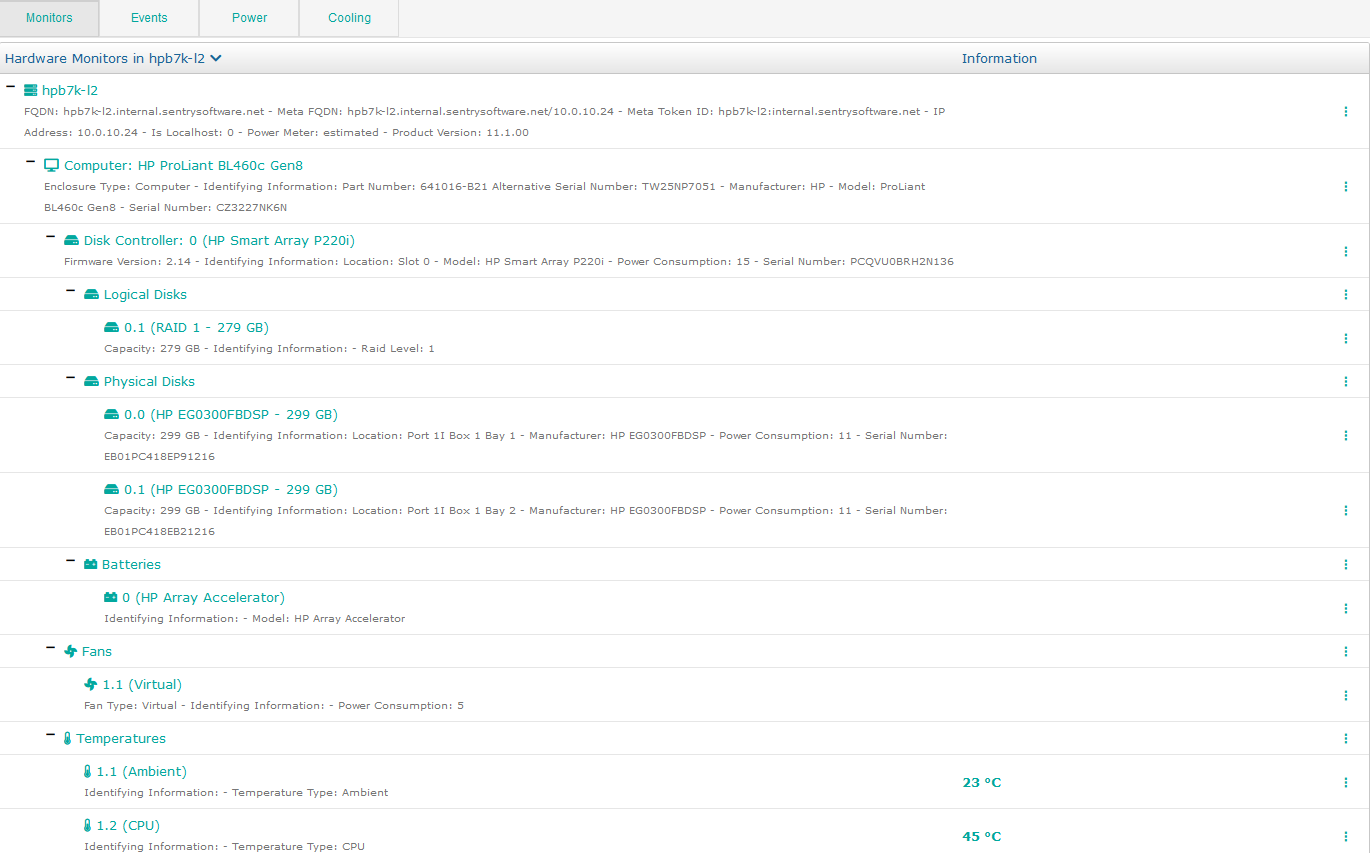


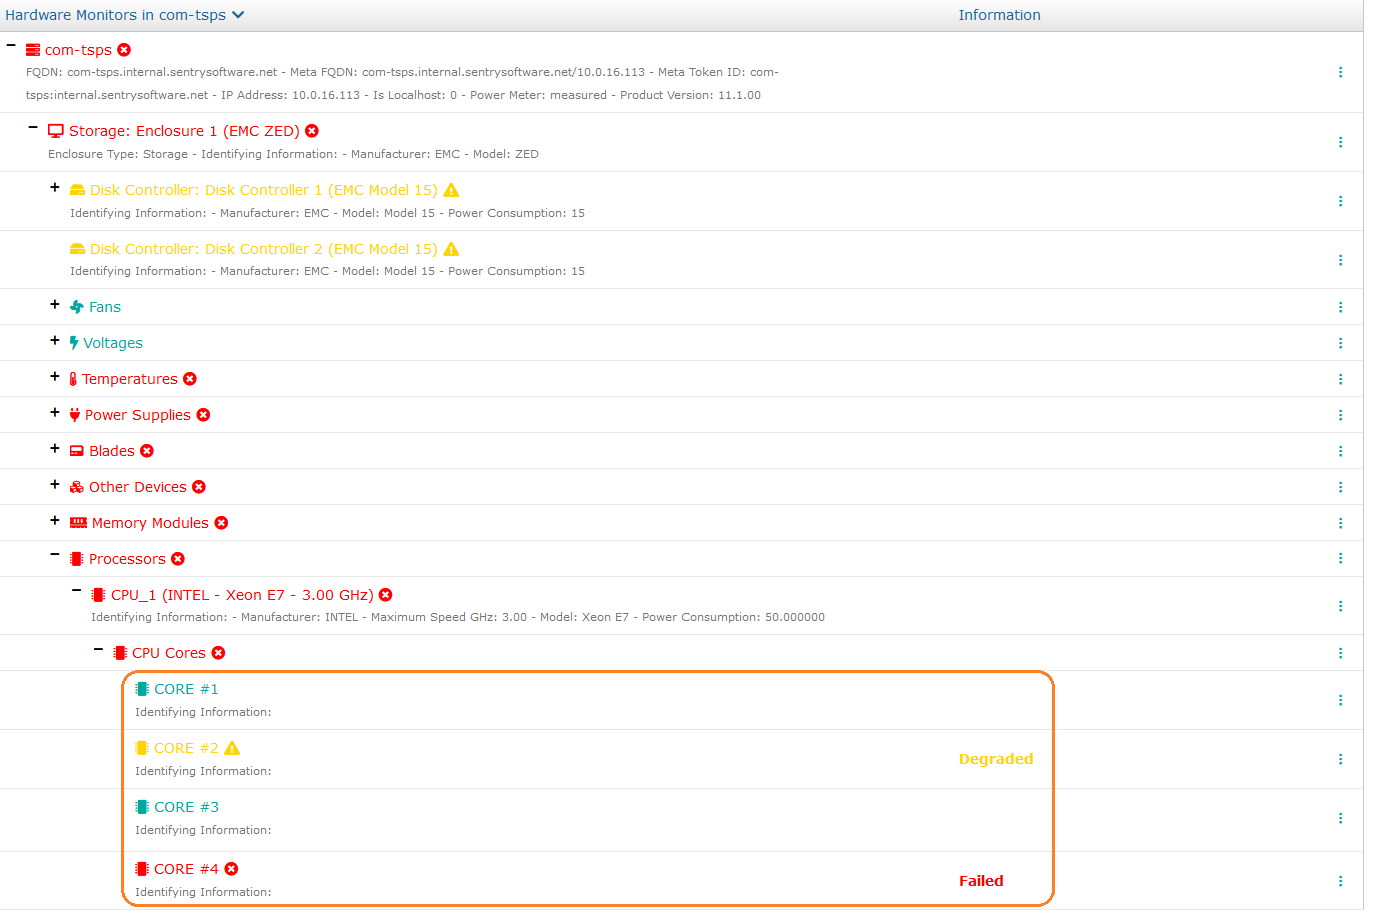
Since the monitors are fetched from the PATROL Agent, additional information collected by Hardware Sentry KM are displayed under each monitor instance (Serial Number, Model, Manufacturer, etc.) and, notably, the current status of each monitored component is displayed. When a Monitor is displayed in red (ALARM) or yellow (WARN), it means the corresponding device is currently failing or degraded (contrary to other views in TSPS where the color represents the number of events in the past).

Checking Disks Health
Most manufacturers typically use the “mean time to failure” or MTTF to indicate the operational reliability of their products. But the advertised MTTF of 1,000,000 hours (or even more!) is misleading. Recent studies show that the average annual replacement rate for hard disks is typically between 3% and 15%. This means that an organization with just 100 servers and approximately 300 hard disks will experience between 9 and 45 disk failures every year which, if they do not impact the availability of the system, will surely degrade the overall performance dramatically. An organization with 1000 servers will experience almost a disk failure each day of the year. Given their relevant short lifetime and the amount of data they store, disks are one of the most critical devices to be monitored.
Monitoring disk health consists in closely monitoring the 3 typical types of disks: disk controllers, physical and logical disks.
Monitoring Disk Controllers
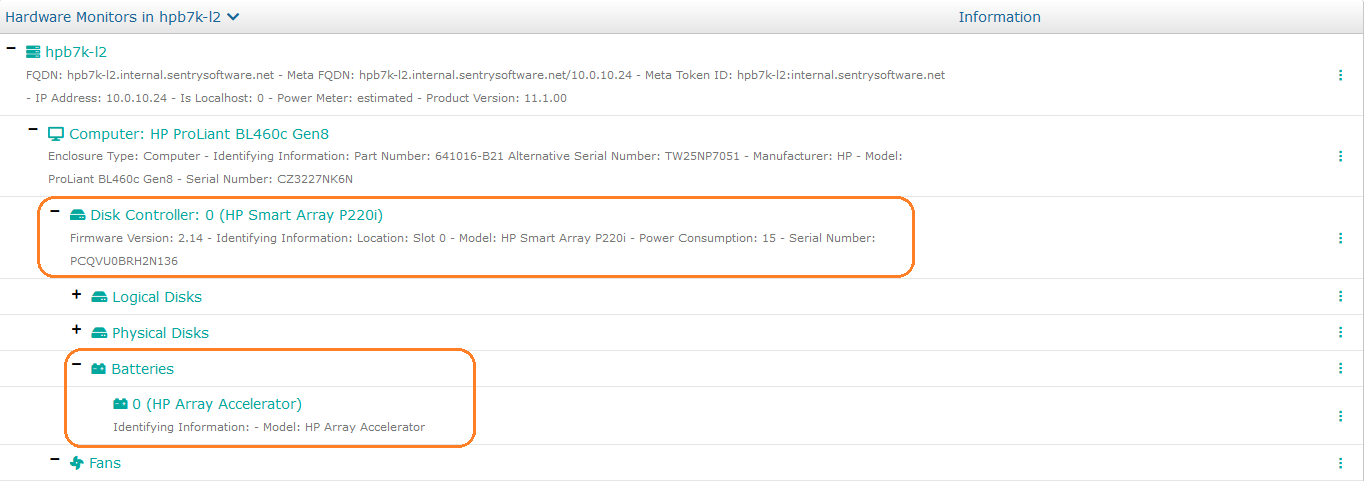
A disk controller is a card inside a computer that connects one or several physical disk drives to the computer and write cache. To keep this write from being lost if power is interrupted, the card must be configured with a battery. It is thus recommended to closely monitor this battery.
- Login to your TrueSight console.
- Select Monitoring > Hardware Devices from the navigation pane and click a physical server.
- From the Monitors list, click a disk controller Monitor. Expand its sub-components to display the batteries Monitor and rapidly verify that none of them are in a WARNING or ALARM state and, therefore capable of supporting the controller in the event of a power failure.
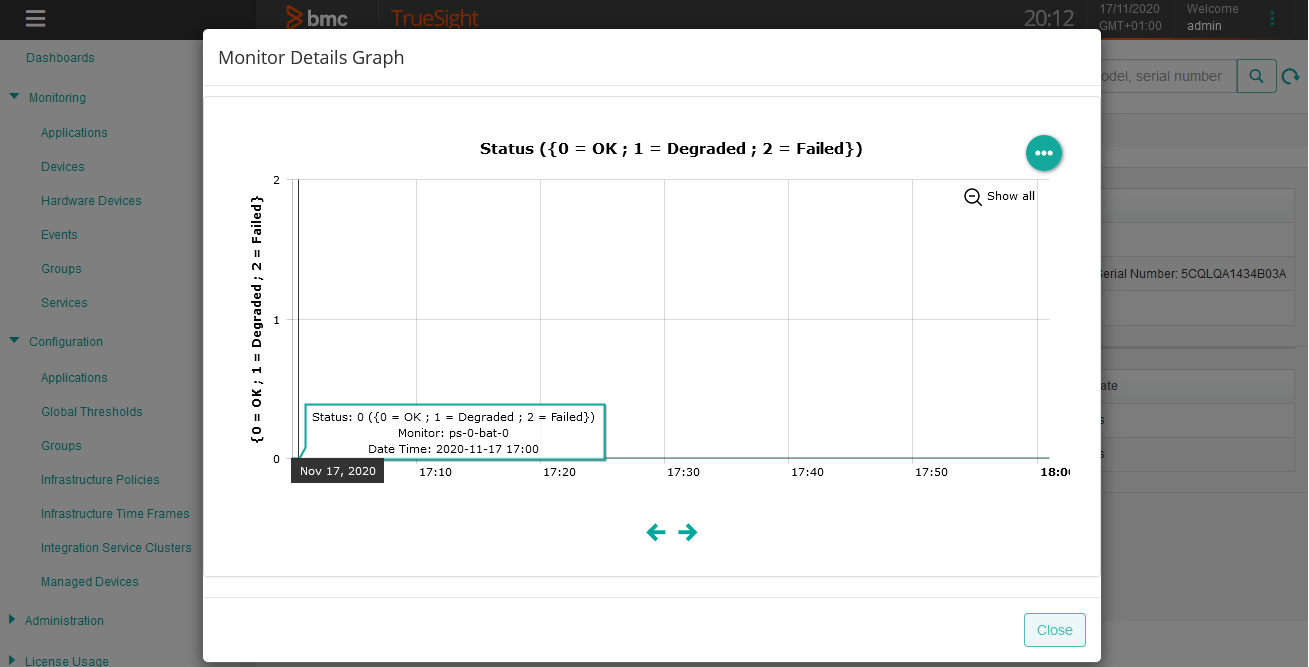
- Click the Battery Monitor to be redirected to the Monitor detailed page where you can view the values of the Status and the Status Information parameters.
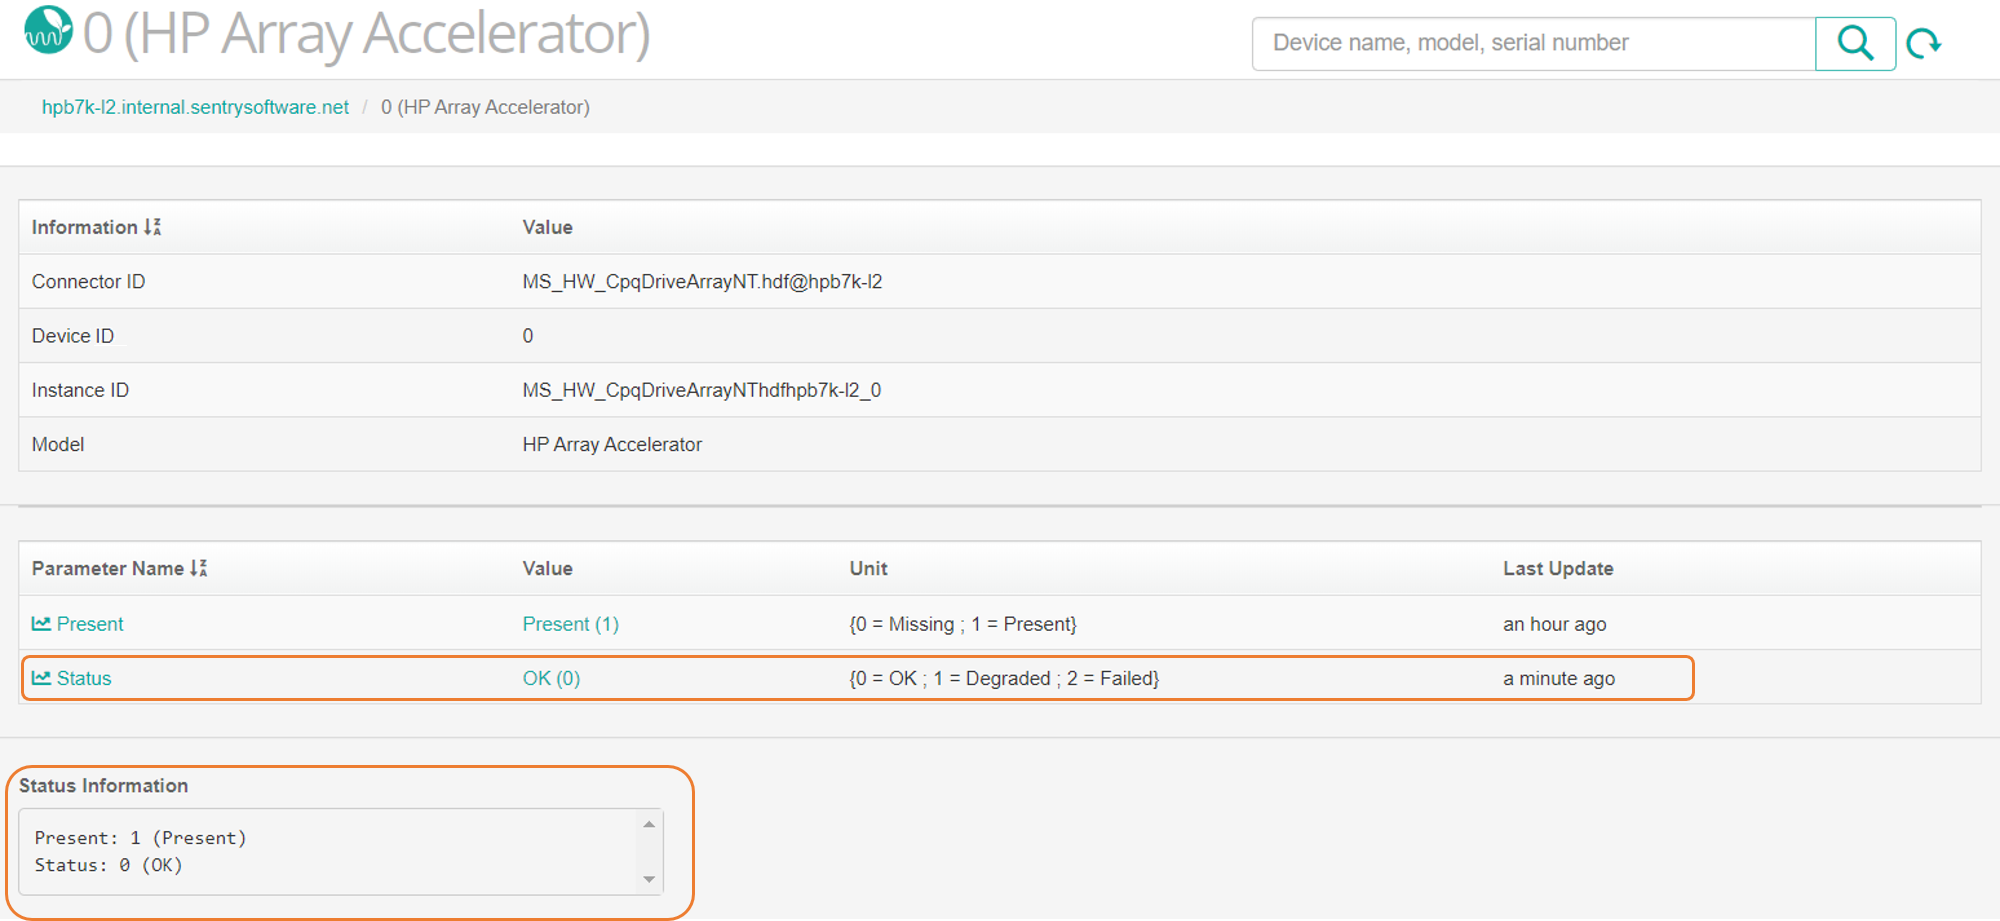
- Click the Status parameter or its value to display a graph showing the history of the battery status values.


It is also recommended to verify the controller health. Perform the same procedure on the Controller Monitor to make sure the controller is not degraded or has not failed.
Monitoring Physical disks
Physical disks must be monitored to avoid loss of data, unavailability and performance degradation. Contrary to other solutions, Hardware Sentry KM monitors the actual physical disks (Hardware Physical Disk) behind the controller and not only the disks as seen by the operating system.
- Login to your TrueSight console.
- Select Monitoring > Hardware Devices from the navigation pane and click a physical server.
- From the Monitors list, locate Physical Disks Monitor and verify that none of them have failed or are being degraded. Errors are displayed in the Information column.
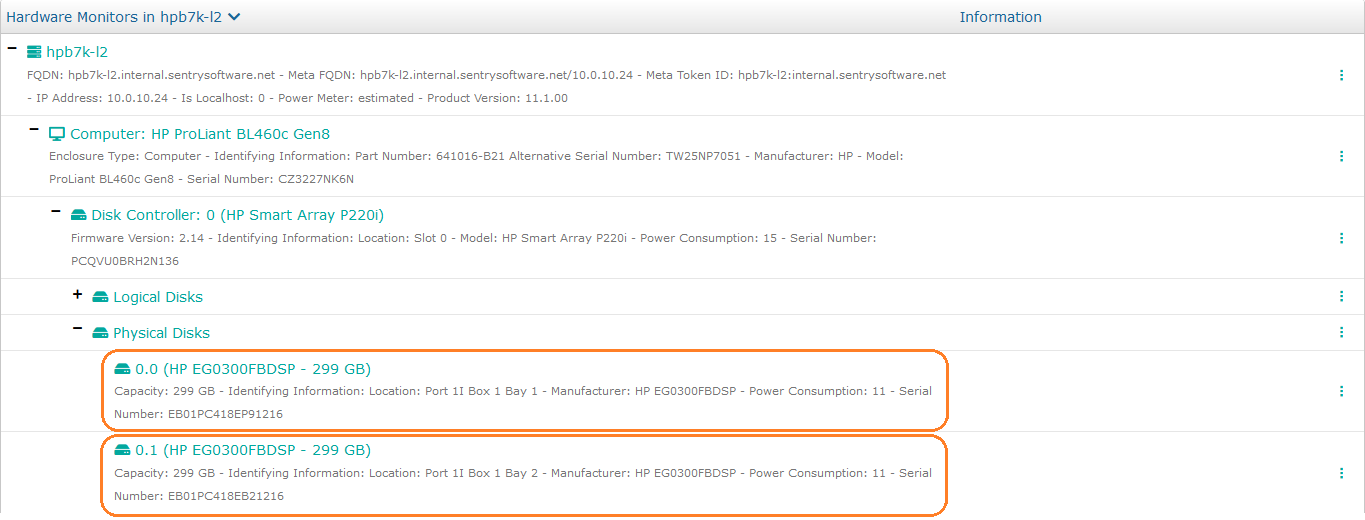
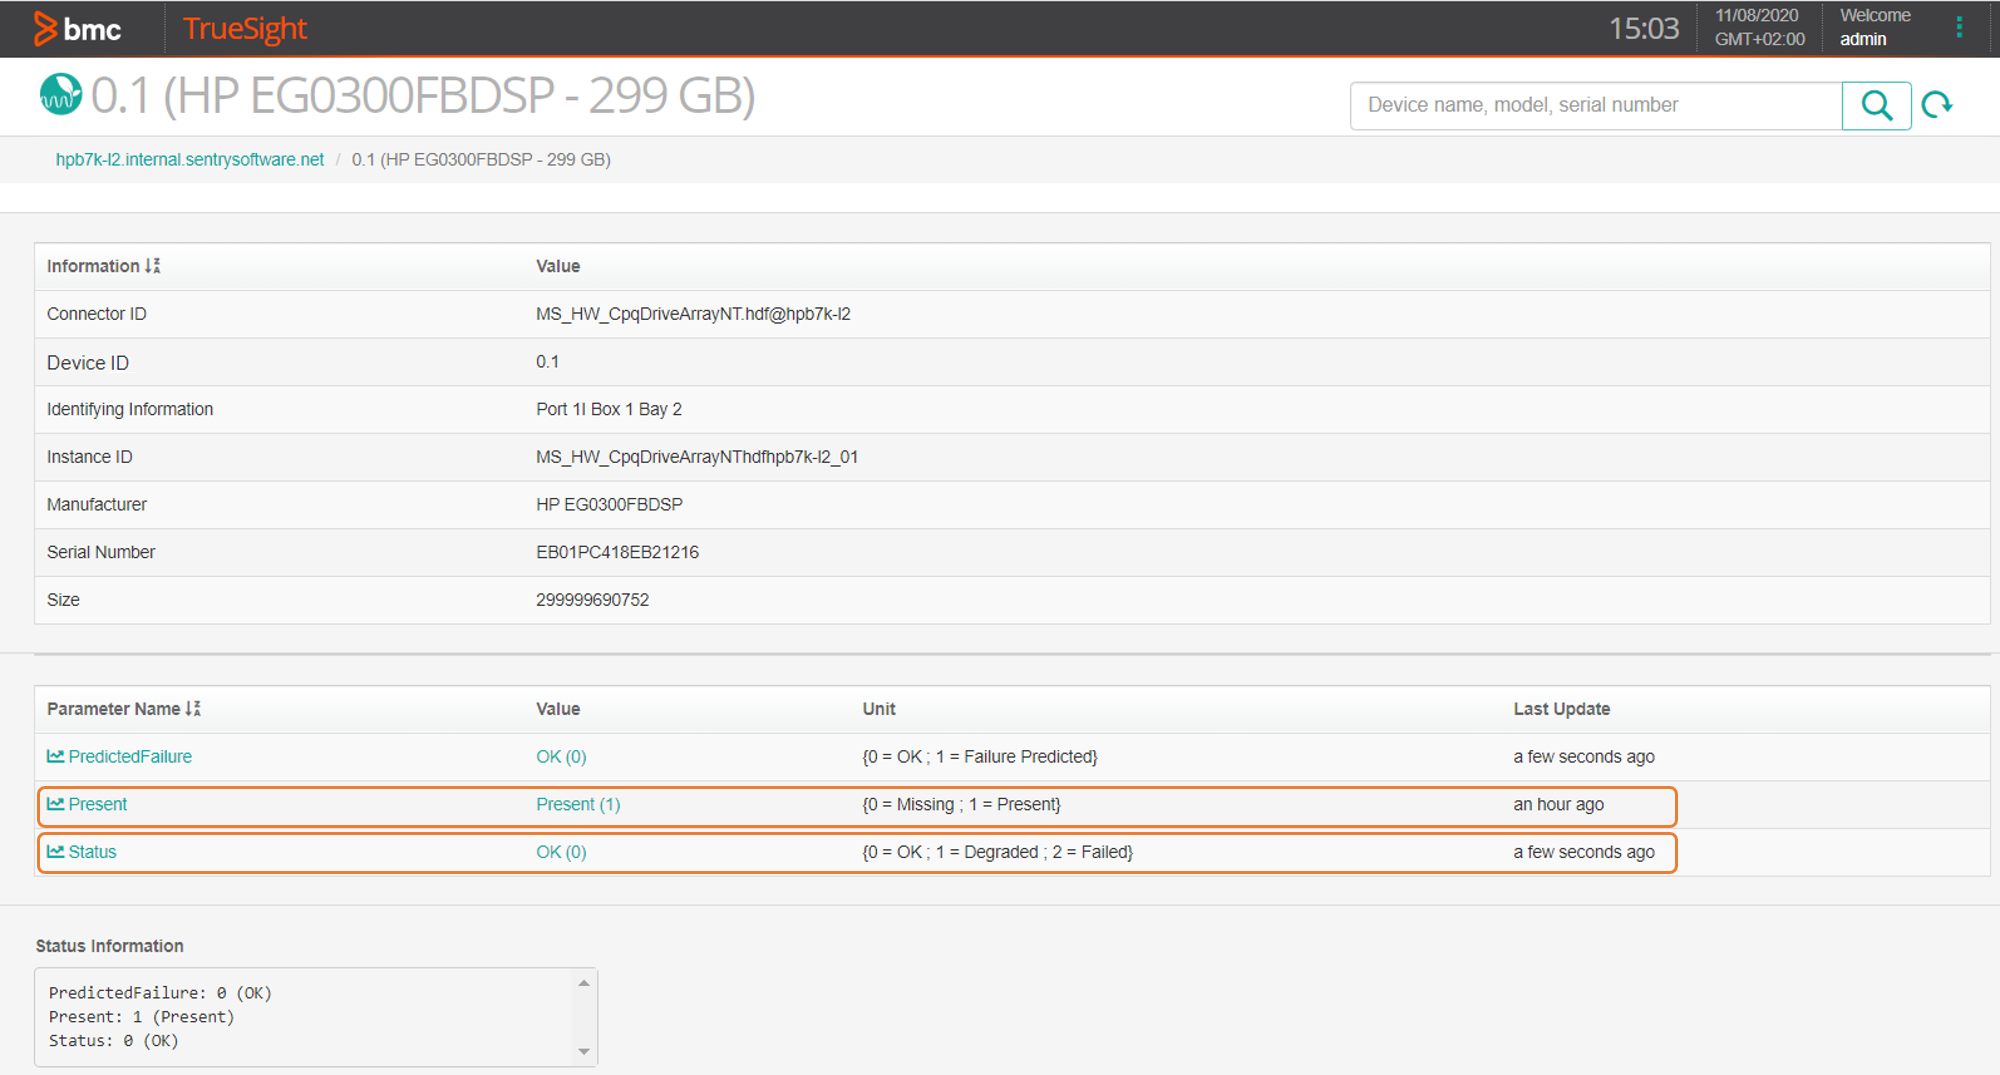
- Click a Physical Disk Monitor to be redirected to the Monitor detailed page where you can view the values for the Present, Status and Status Information parameters.


Monitoring Logical Disks
RAID or advanced disk controllers expose several physical disks as a single logical disk to the operating system. The information required by administrators is mainly the logical disk's status, its RAID type and size. To get that information:
- Login to your TrueSight console.
- Select Monitoring > Hardware Devices from the navigation pane and click a physical server.
- From the Monitors list, expand the Physical Disks Monitor and click a Logical Disk Monitor to be redirected to the Monitor detailed page.
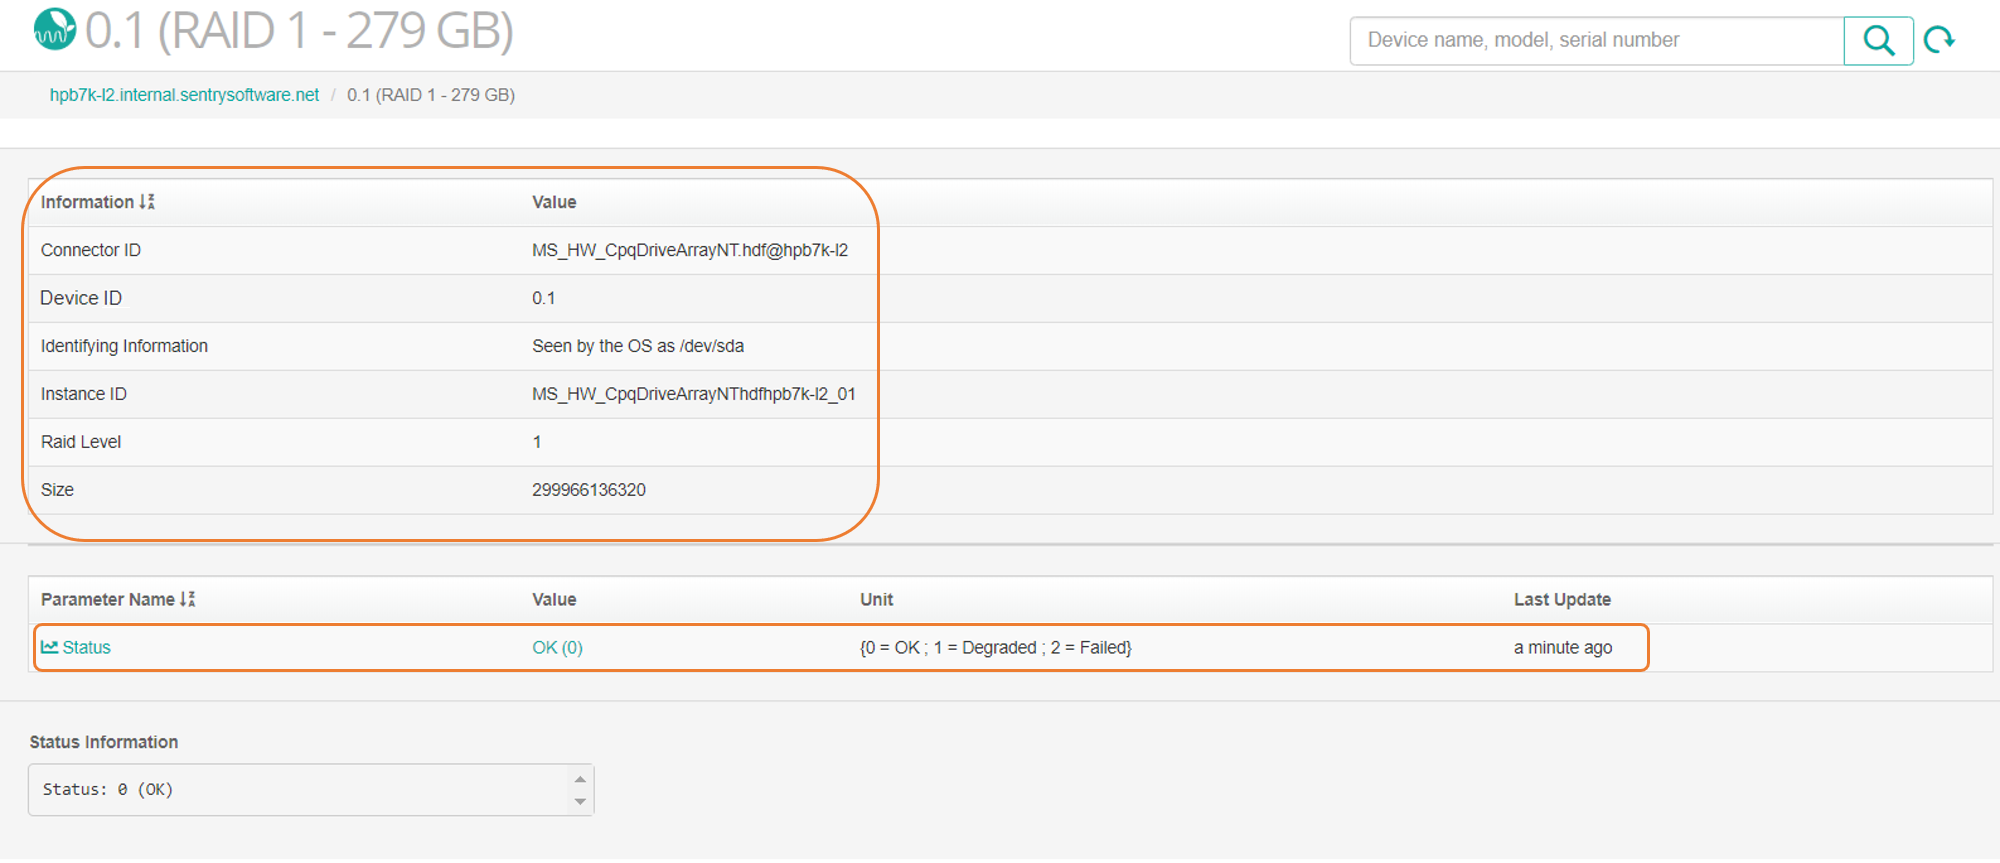
- Click the Status parameter to display a graph showing the history of the status values for the logical disk.

Adopting a predictive approach to monitoring a datacenter includes to closely monitor the state and performance of key-components such as processors and disk drives. The valuable indicators provided by Hardware Sentry KM helps IT administrators implement and maintain a proactive monitoring strategy.
Diagnosing Datacenter Electrical Issues
Understanding the basics of the electrical distribution system can help IT administrators diagnose data center electrical issues. Power is delivered to a data center by the local utility company. Once inside the building, the utility power goes to the Automatic Transfer Switch and to the uninterruptible power supply (UPS) units. These units clean the incoming utility system before passing it to power distribution units (PDUs) for conversion. Power will finally be distributed to electrical outlets and servers. During the distribution, power loss or instability can occur. It can be caused by voltage or AC/DC conversion, hence the importance to monitor voltage and power supplies.
To monitor voltage
Monitoring voltage helps verify the quality of power supplies. In fact, if the power supply is weak, the voltage level on the motherboard will not be steady, which could lead to random crashes or to errors at the processor or memory levels.
- Login to your TrueSight console.
- Select Monitoring > Hardware Devices from the navigation pane and click a physical server.
- From the Monitors list, locate the Voltages Monitor.
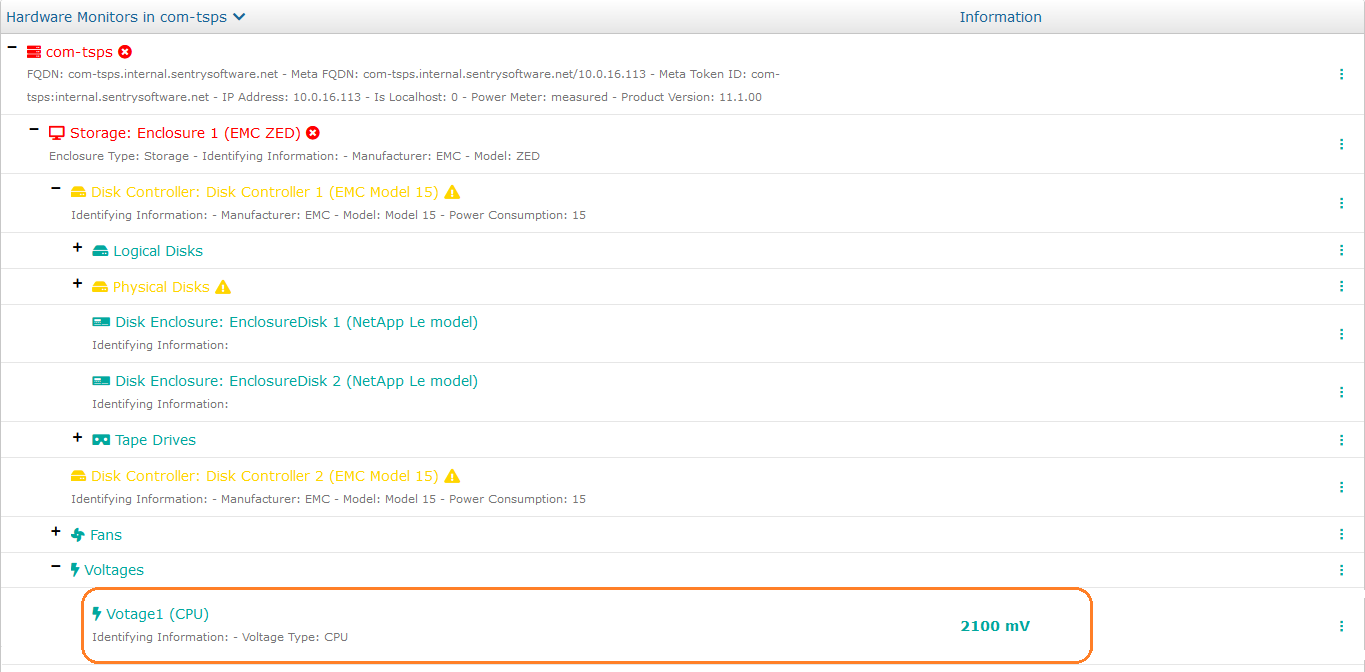
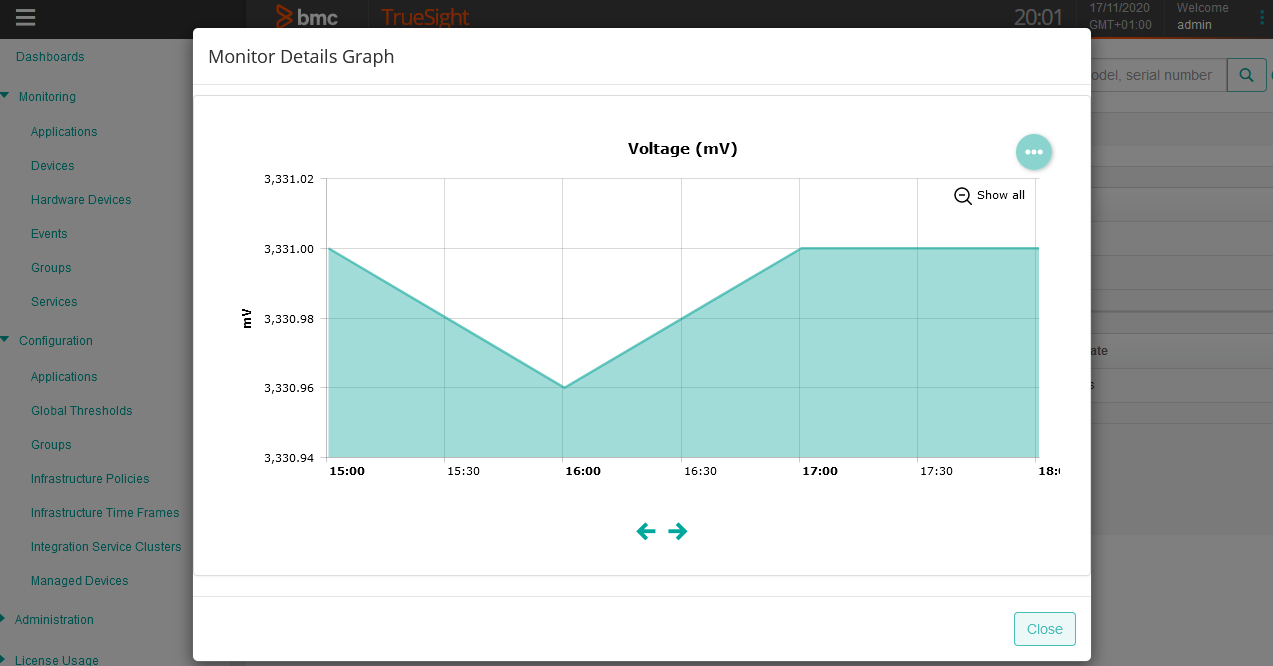
- Click the voltage value in the Information column, to display a graph showing the voltage (mV) history. Use the arrow buttons located at the bottom of the graph to navigate through the time range.


Higher voltage and fewer fluctuations in voltage will always guarantee better efficiency. If you notice voltage fluctuations, verify your electrical connections and wiring.
To monitor power supplies
After hard drives, the power supply is the device that is most likely to fail. The proper functioning of this device highly depends on the quality of the data center electrical distribution. Indeed, voltage fluctuations are detrimental to power supplies: they can shorten their life span or lead to severe malfunction.
- Login to your TrueSight console.
- Select Monitoring > Hardware Devices from the navigation pane and click a physical server.
- From the Monitors list, locate the Power Supplies Monitor and verify that none of the power supplies have failed or is degraded.
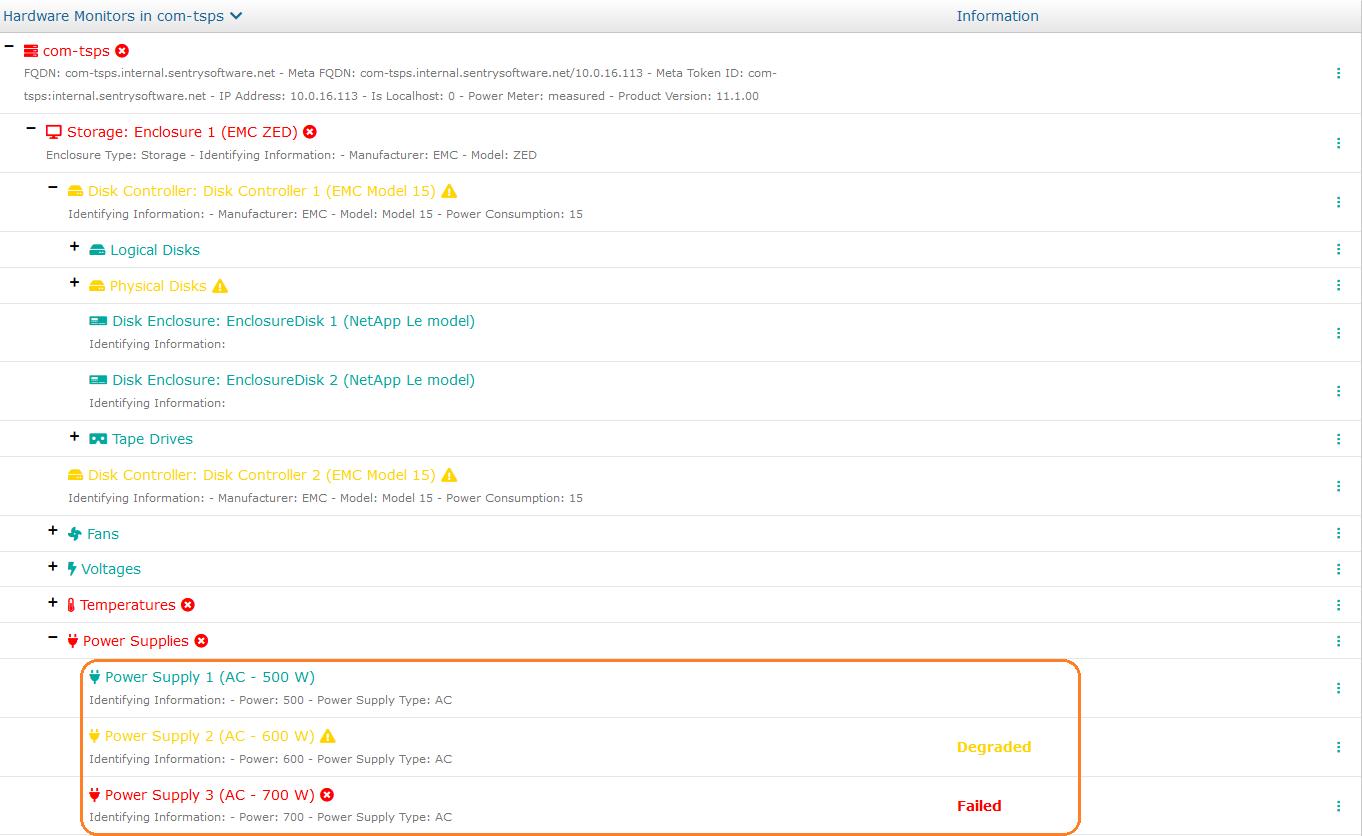
- Click a Power Supply Monitor to be redirected to the Monitor detailed page where you can view the values of the Present, Status and Status Information parameters.
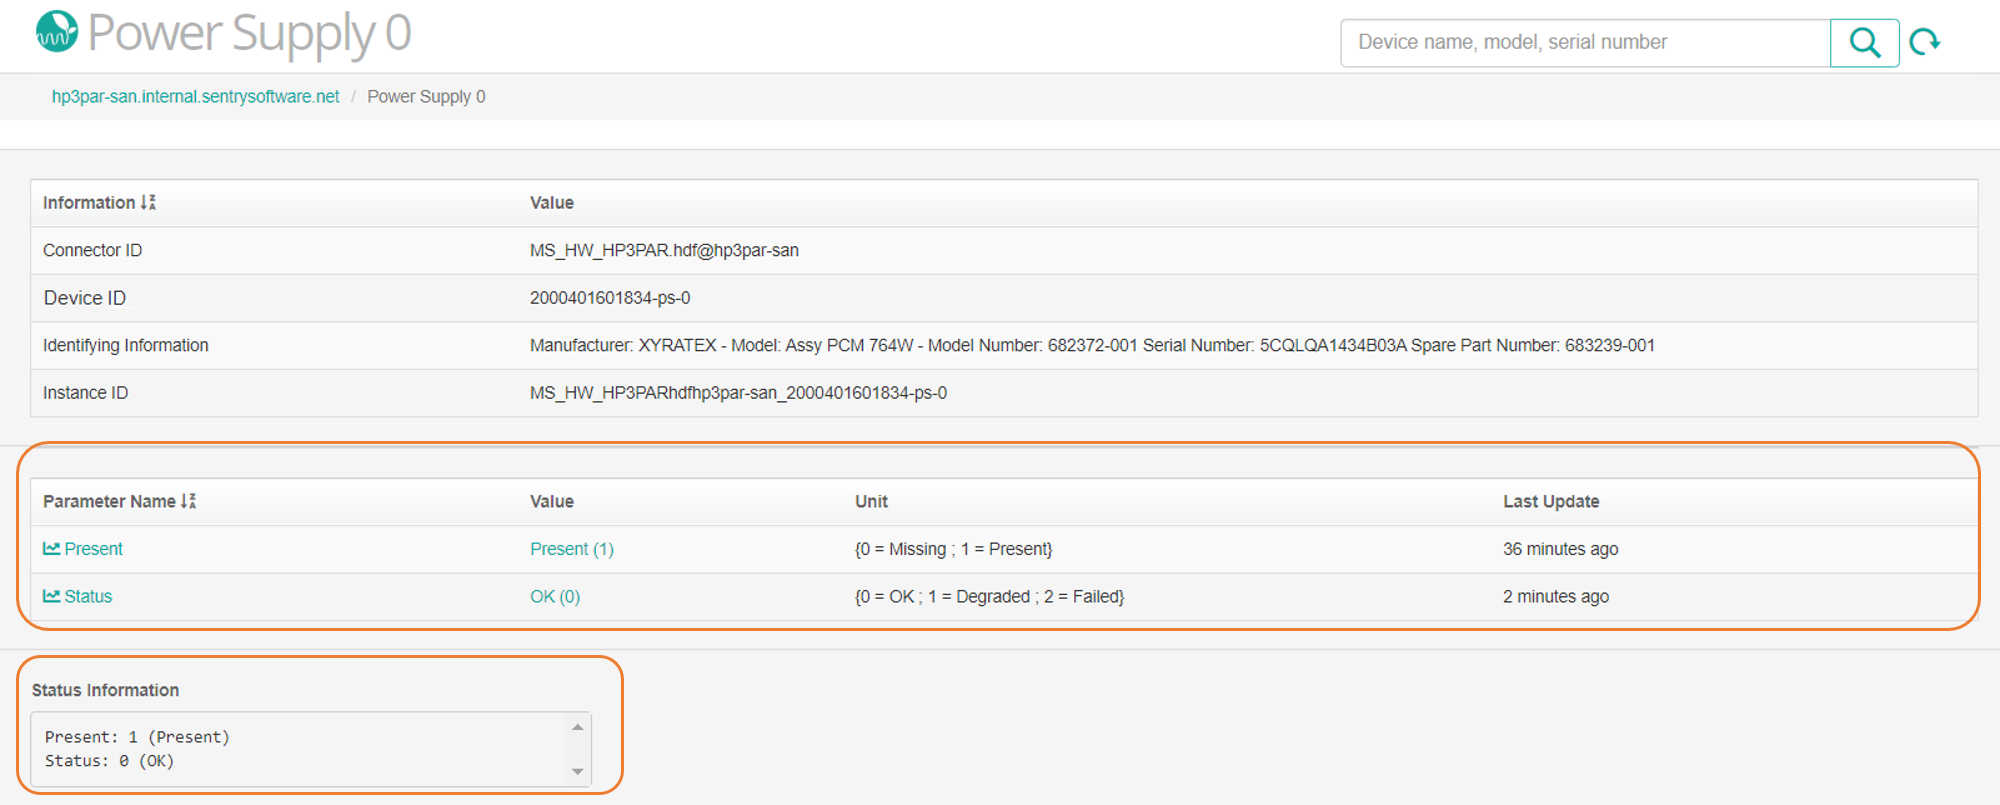
- Click the Present parameter to display a graph showing the power supply history.


To monitor the fan performance of servers
The temperature inside a server case is controlled with fans. To prevent internal temperature to get too high, verify that the fan is operating properly.
- Login to your TrueSight console.
- Select Monitoring > Hardware Devices from the navigation pane and click a physical server.
- From the Monitors list, locate the Fans Monitor.
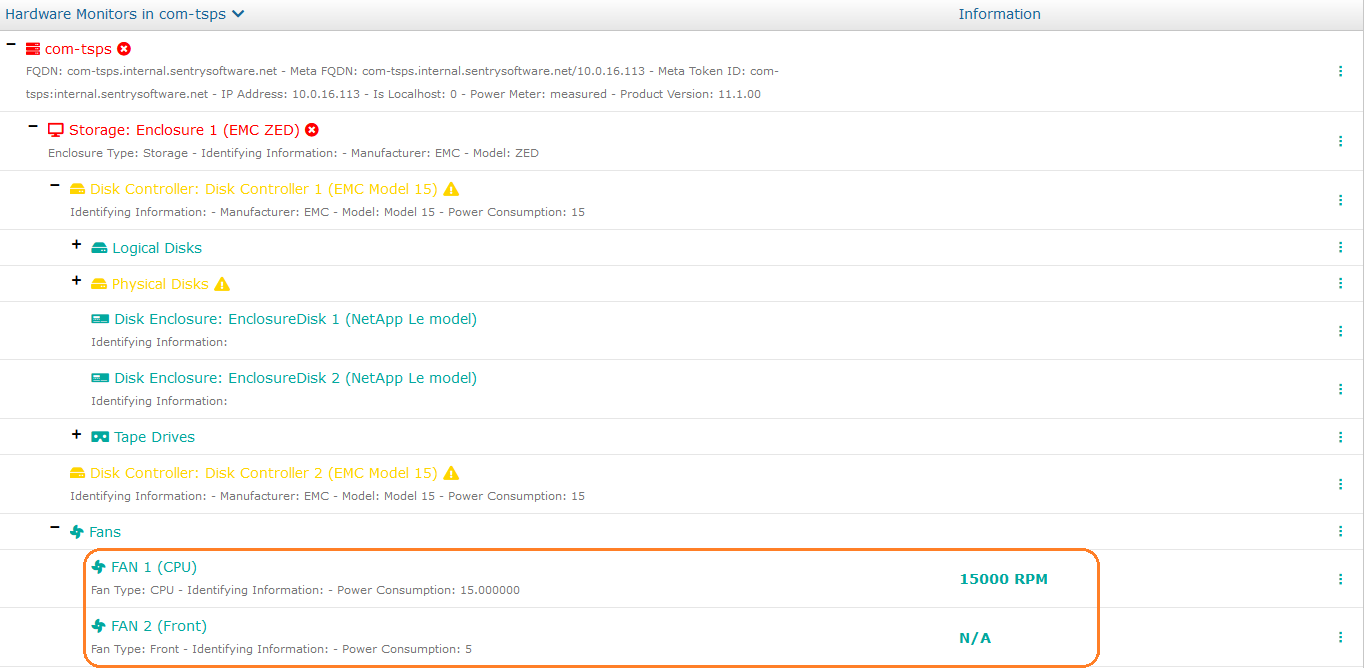
- Click a Fan Monitor to be redirected to the Monitor detailed page where you can view the values of the Present and Status parameters.
- Click the Speed parameter to display a graph showing the history of the speed values for the fan.
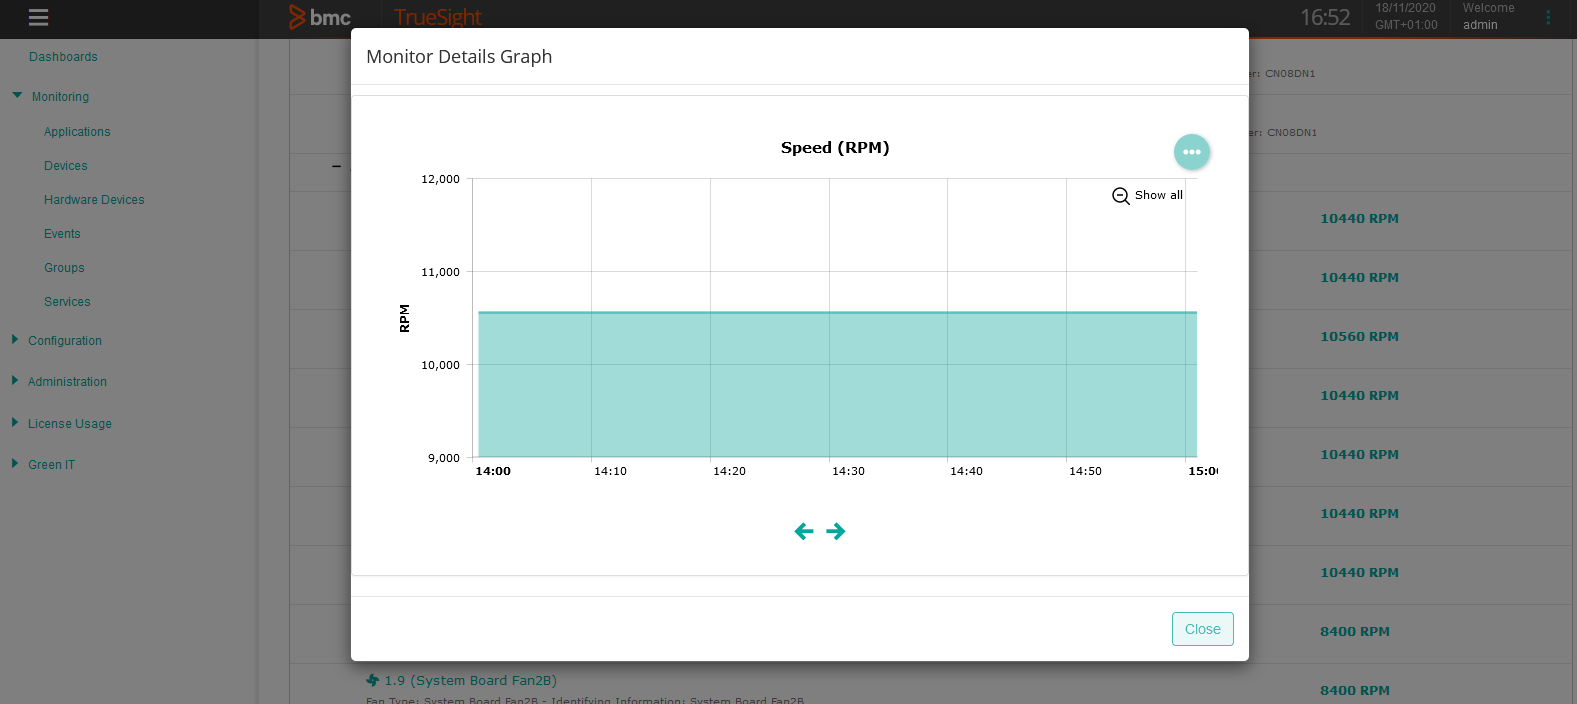


A fan which is no longer spinning or is turning too slowly should be replaced immediately.
To monitor the temperature of devices
Monitoring temperature sensors helps identify which device is properly operating and which is in poor or critical condition.
- Login to your TrueSight console.
- Select Monitoring > Hardware Devices from the navigation pane and click a physical server.
- From the Monitors list, locate the Temperatures Monitor and verify that no sensor is in an ALARM or WARNING state.
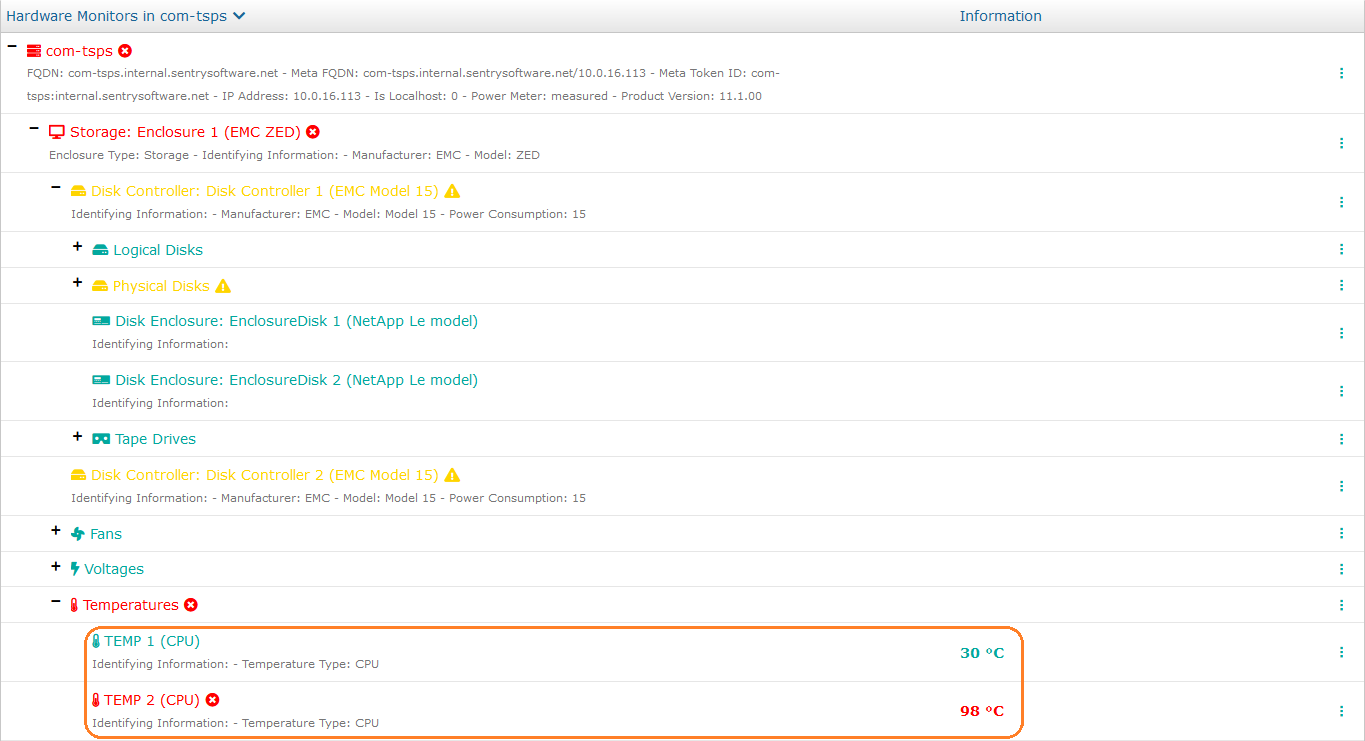
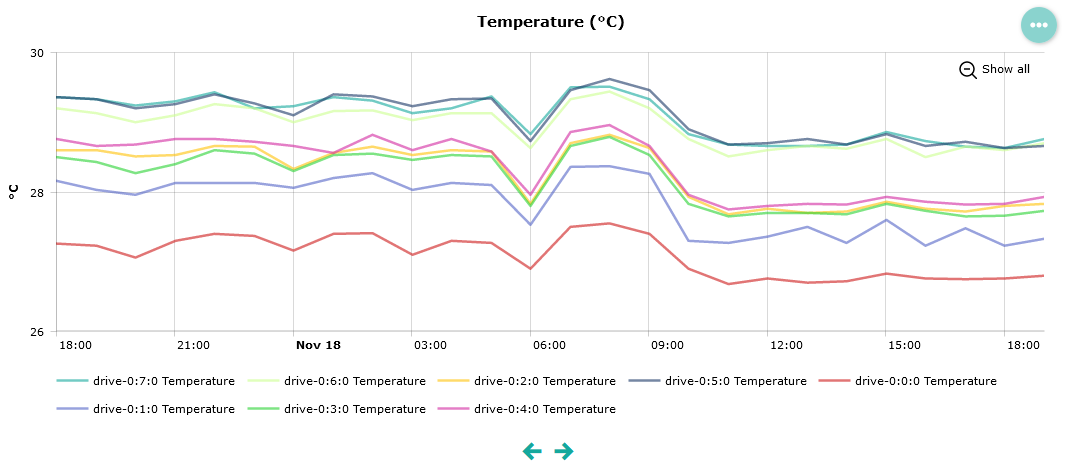
- Click the Temperature value (°C) in the Information column to display a graph showing the history of the temperature values.
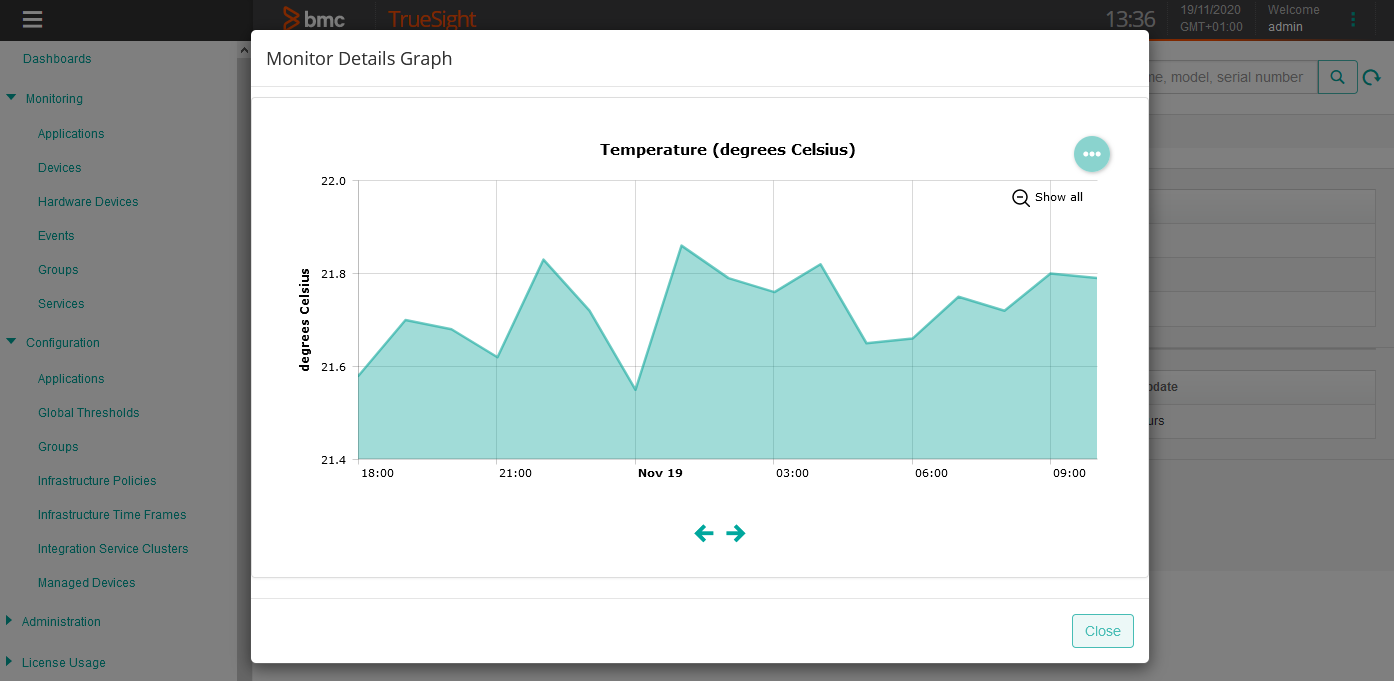
- To get even more precise information about all the temperature sensors click the Cooling tab of a physical server page to display:
- a graph showing the Degrees Below Warning (°C) values for all the temperature sensors of the devices
- a graph showing Temperatures values collected for each sensor of the device.


Monitoring Network Traffic & Preventing Bottlenecks
Applications rely on the network whose bandwidth and latency has a dramatic impact on the overall measured and perceived IT performance. Hardware Sentry KM monitors the connectivity and the quality of the network connections. The incoming and outgoing traffic is also constantly measured against the available bandwidth to give system administrators the short term and long-term visibility on the network capacity utilization.
To verify a network connection
- Login to your TrueSight console.
- Select Monitoring > Hardware Devices from the navigation pane and click a physical server.
- From the Monitors list, locate the Network Interfaces Monitor and verify that none of the network interfaces are in an ALARM or WARNING state.
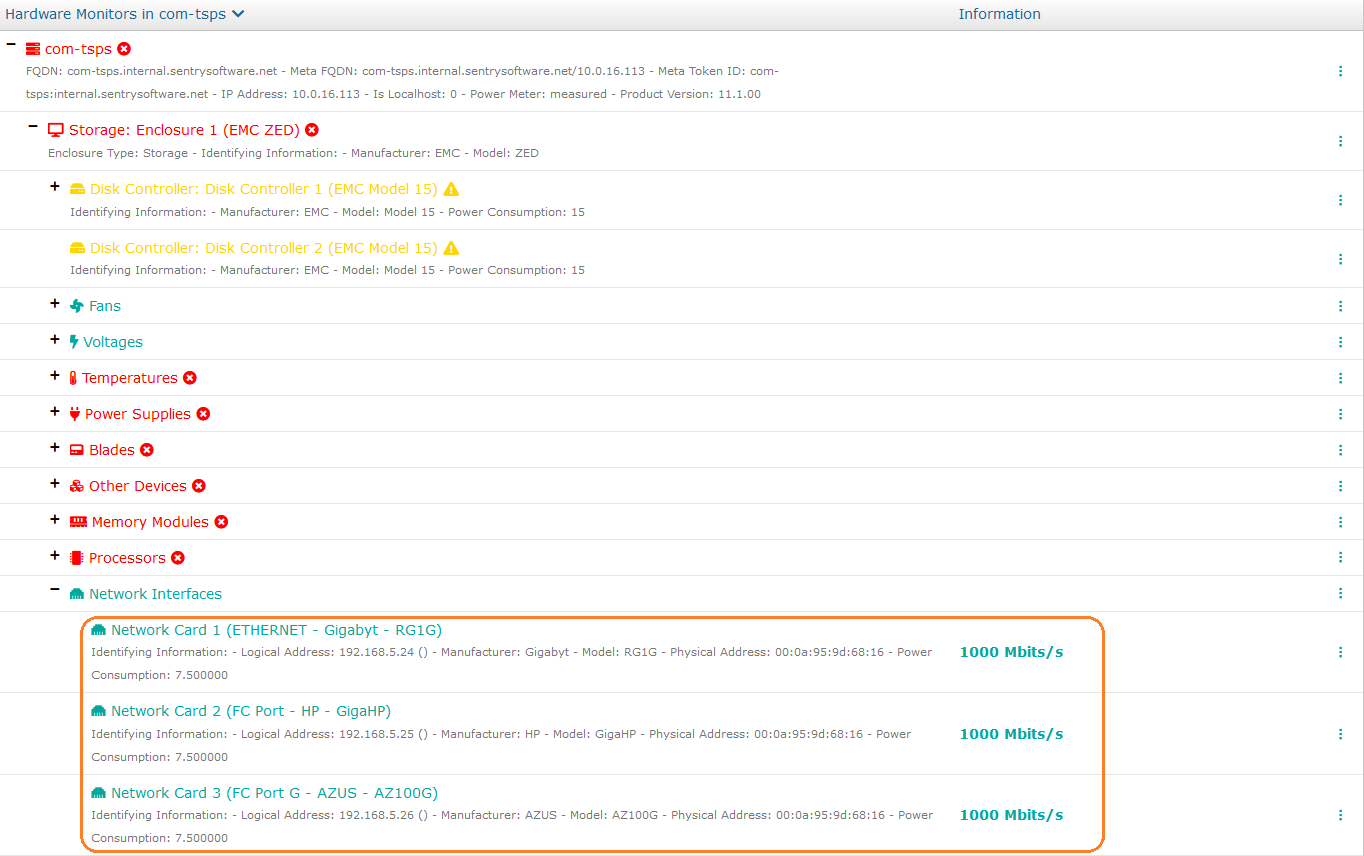
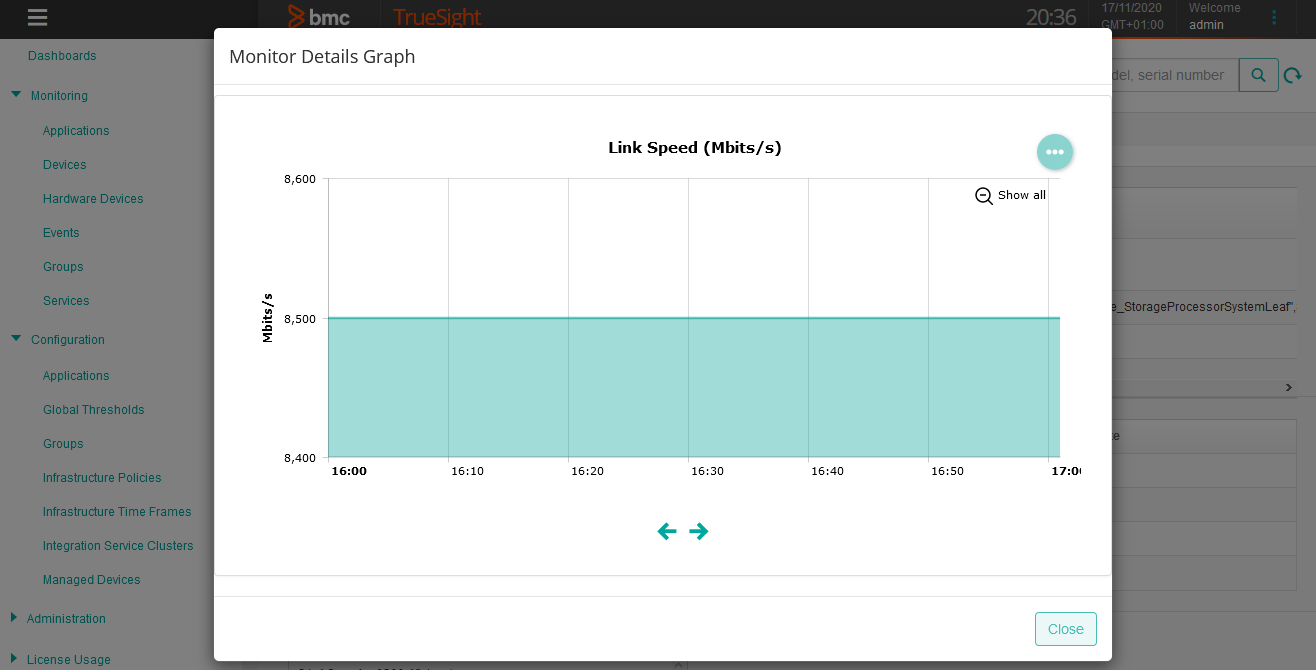
- Click the Link Speed value of a network interface in the Information column, to display a graph showing the history of the Link Speed values. Use the arrow buttons located at the bottom of the graph to navigate through the time range. For Ethernet or fiber adapters, any movement on this parameter indicates that the quality of the connection is poor and needs to be improved. By default, a warning event is triggered when the link speed downgrades from its current value to a lower value (from 1Gb/s to 100Mb/s for example).
- Click a Network Interface Monitor to be redirected to the Monitor detailed page where all the network interface's parameters are displayed.


To monitor the transmission rates
Transmission rates monitoring provides administrators with valuable information about the incoming and outgoing data managed by servers and switches and help identify the traffic demands and peak periods.
- Login to your TrueSight console.
- Select Monitoring > Hardware Devices from the navigation pane and click a physical server.
- From the Monitors list, locate the Network Interfaces Monitor.
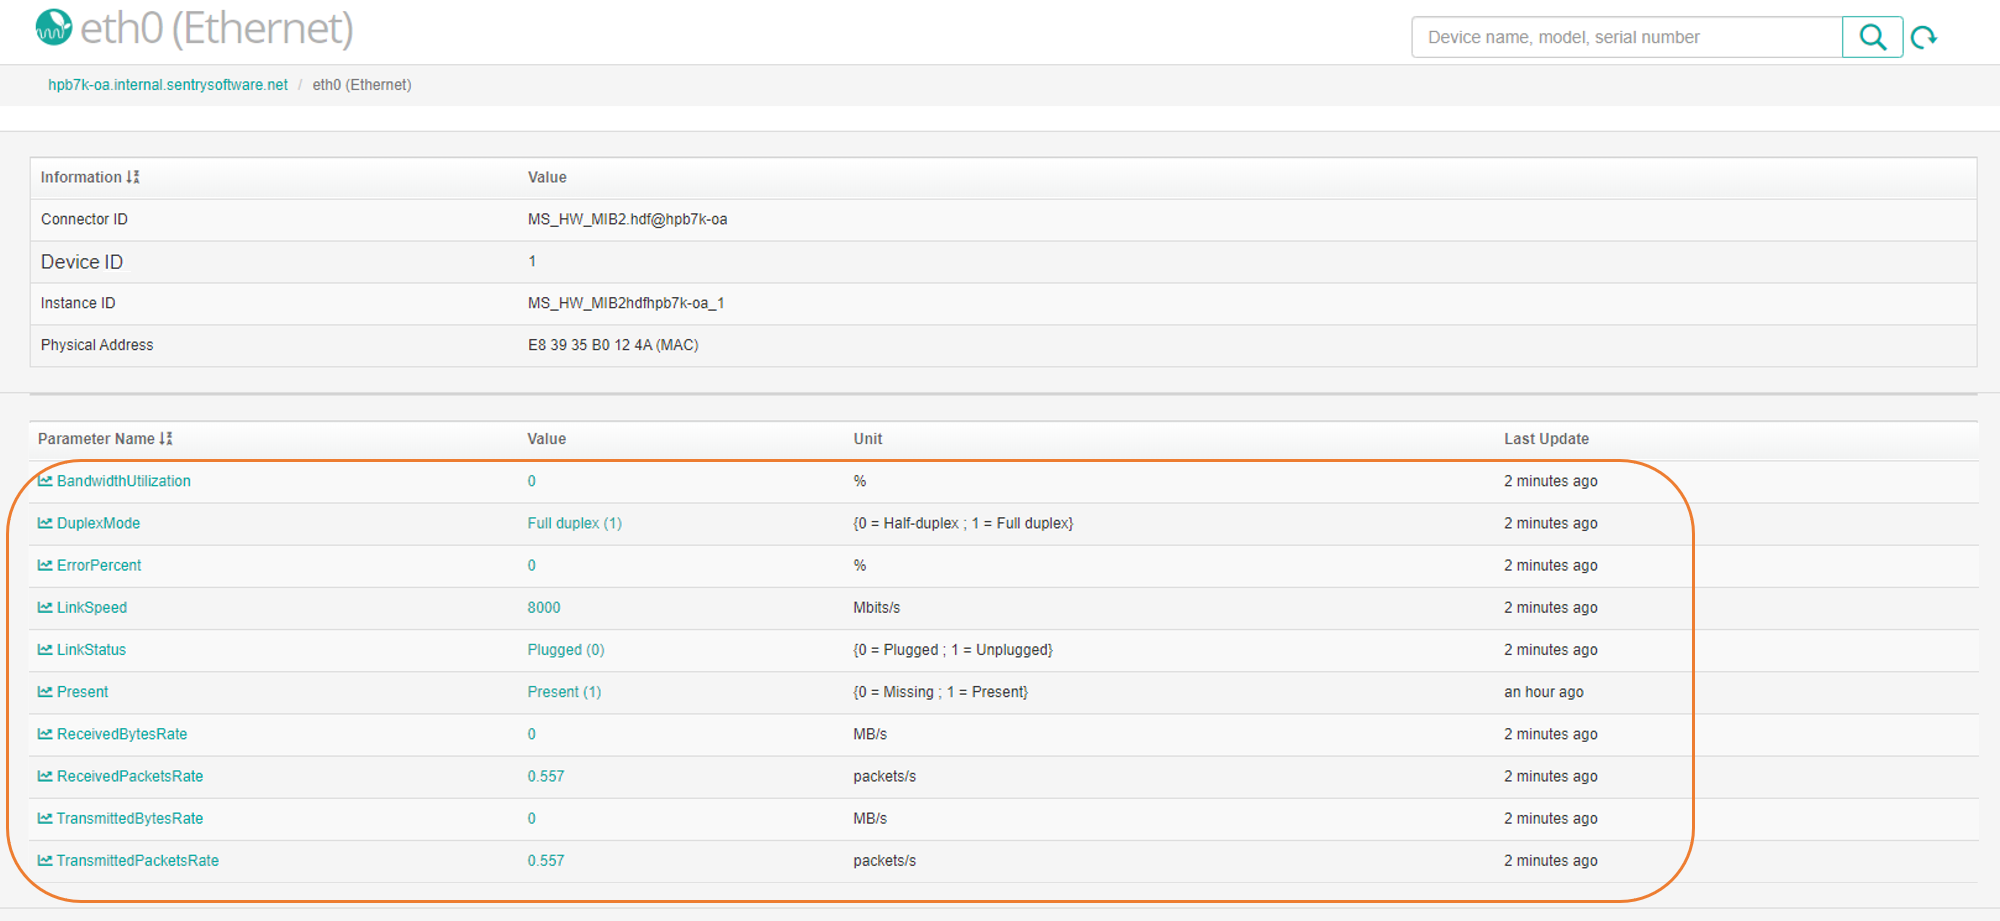
- Click a Network Interface to be redirected to the Monitor detailed page where all the network interface's parameters are displayed.
- Click the Received Packets Rate, Transmitted Packets Rate, Received Bytes Rate and Transmitted Bytes Rate to view the transmission rates of your network interface.
To monitor the bandwidth utilization
Monitoring the bandwidth utilization of network interfaces can help identify unexpected and random peaks in the network activity, which could hide business critical issues, such as a network attack or unauthorized transfer of data.
The Bandwidth Utilization parameter can ONLY be collected if Link Speed, Duplex Mode, Received Bytes Rate and Transmitted Bytes Rate are all properly collected.
- Login to your TrueSight console.
- Select Monitoring > Hardware Devices from the navigation pane and click a physical server.
- From the Monitors list, locate the Network Interfaces Monitor.
- Click a Network Interface to be redirected to the Monitor detailed page where all the network interface's parameters are displayed.
- Click the Bandwidth Utilization parameter to display a graph showing the history of the bandwidth utilization values. Use the arrow buttons located at the bottom of the graph to navigate through the time range.
Predicting Hardware Failures
Even though end-users expect the IT environment they rely on to be flawless, it is common knowledge that hardware components are inherently prone to failure. In most cases, electronic components work as expected or fail completely and it is rare to be able to observe such components degrade slowly over time. That is the reason why Hardware Sentry KM only reports the overall status for most object classes as simply “OK” or “Failed”.
However, some components are able to report their own degradation and warn the administrator of an imminent failure. Such components include:
- the processors (the more computation errors they detect and correct automatically, the more likely they will fail soon).
- the memory modules (an increasing number of fixed ECC errors means the module is nearing its end of life).
- the hard disks (many internal metrics are constantly analyzed by the disk itself to assess its own health and predict an imminent failure – this technology is standard and is called S.M.A.R.T.).
When such information is properly reported by the component or the instrumentation layer of the system itself, Hardware Sentry KM will trigger an event to warn the administrators that an imminent failure of a processor, a memory module or a physical disk is likely to occur.
To monitor potential hardware failures
- Login to your TrueSight console.
- Select Monitoring > Hardware Devices from the navigation pane and click a physical server.
- From the Monitors list, locate the Processors Monitor.
- Click a Network Interface to be redirected to the Monitor detailed page where all the network interface's parameters are displayed.
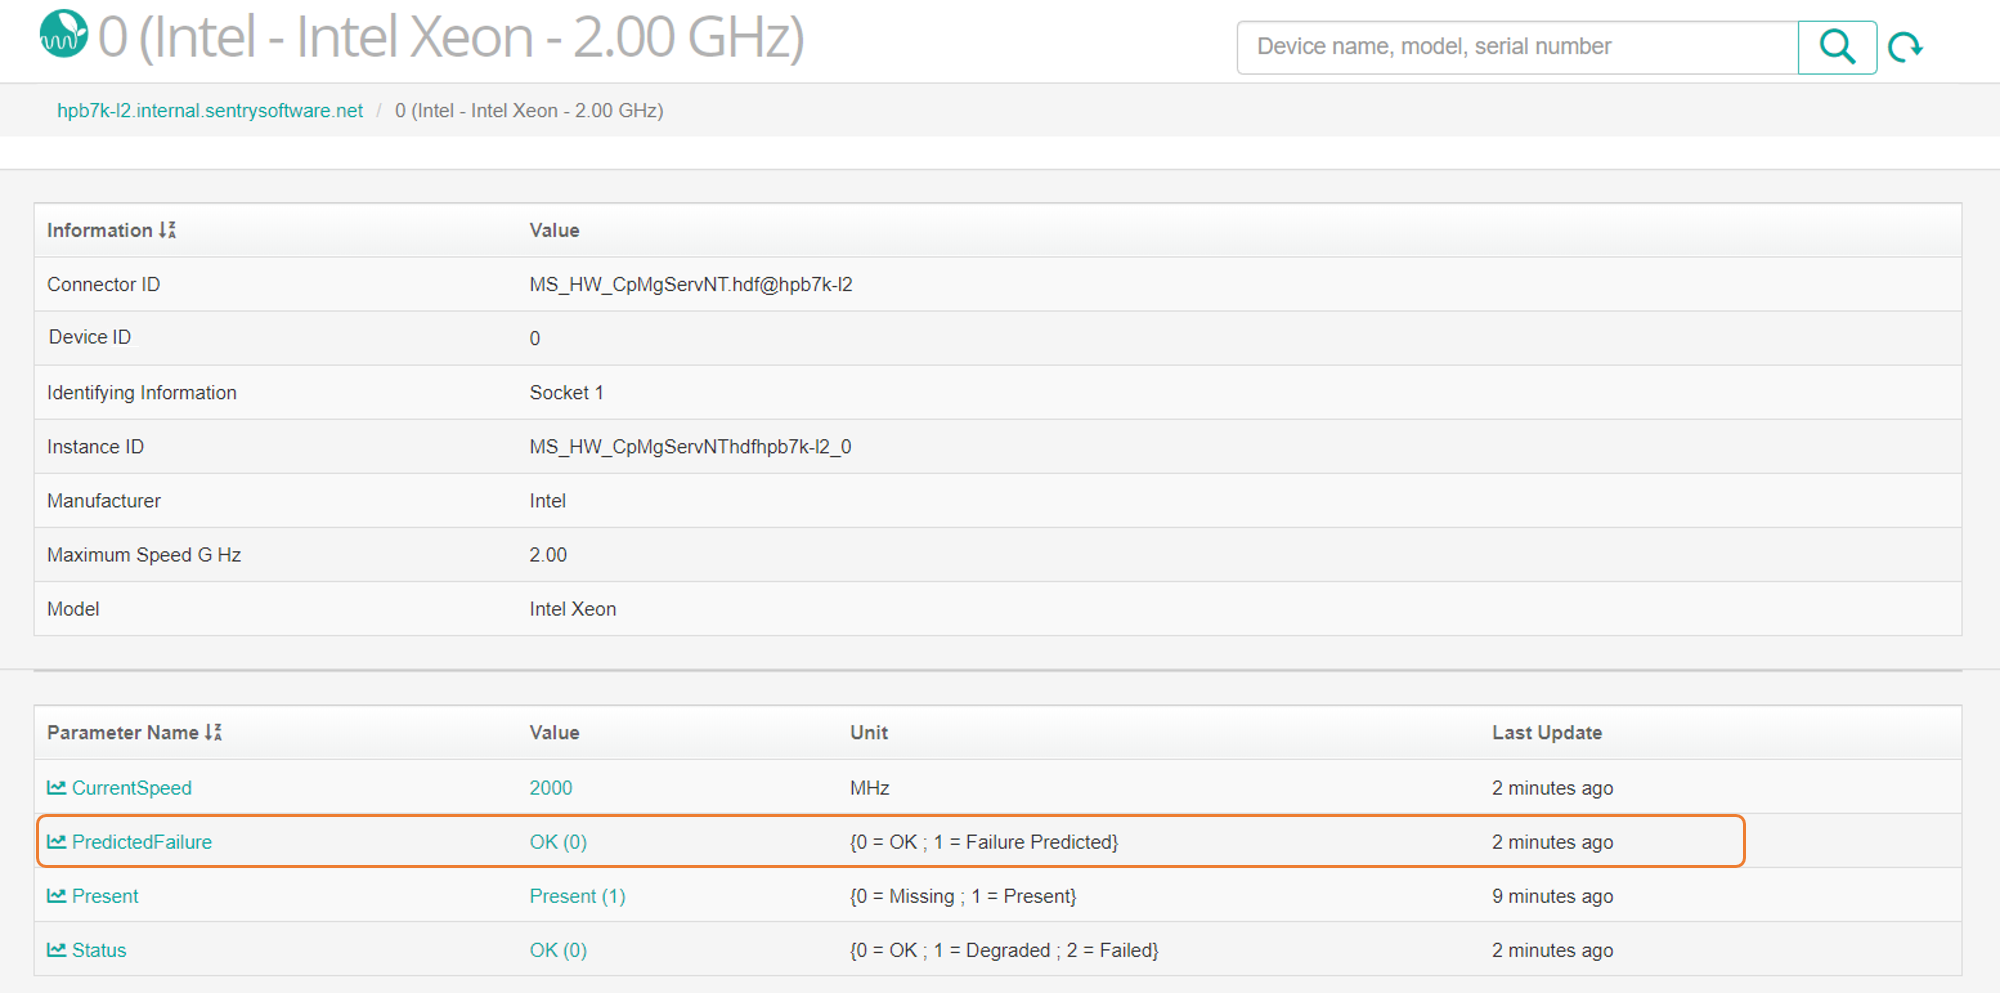
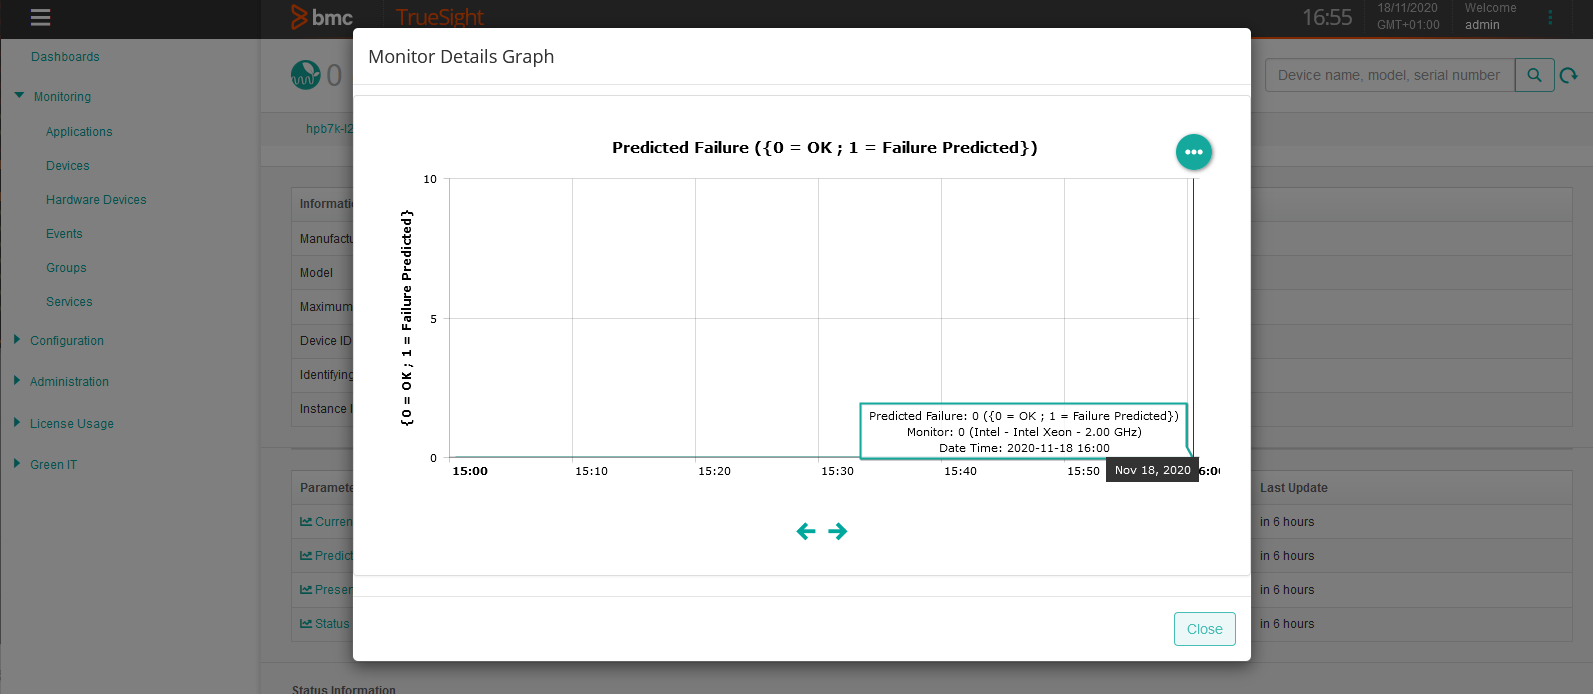
- Click the Predicted Failure parameter to display a graph showing the history of the predicted failure values. If this parameter shows values equal to 1 and goes into alarm, the faulty hardware should be replaced.


Scheduling Automatic Reports
Hardware Sentry KM can automatically produce text reports about the monitored systems.
To schedule automatic reports:
-
Click Add Monitoring Configuration and scroll down to the Reporting section.
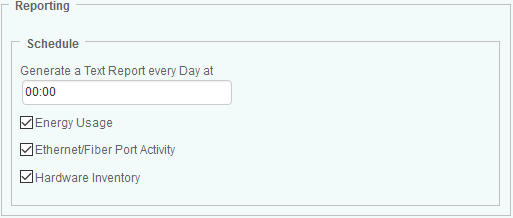
-
In the Schedule section, specify the time at which the report(s) must be generated.
-
Check the:
- Energy Usage report type to automatically generate an Energy Usage report that will be saved as
MS_HW_energyUsage*.csvin the%PATROL_HOME%\logor$PATROL_HOME/logfolder of the PATROL Agent - Ethernet/Fiber Port Activity report type to automatically generate an Ethernet/Fiber Port Activity report that will be saved as
MS_HW_networkActivity*.csvin the%PATROL_HOME%\logor$PATROL_HOME/logfolder - Hardware Inventory report type to automatically generate a Hardware Inventory report that will be saved as
MS_HW_hardwareInventory*.csvin the%PATROL_HOME%\logor$PATROL_HOME/logfolder
- Energy Usage report type to automatically generate an Energy Usage report that will be saved as
-
Click OK to save your settings.

Updating a policy that sets the scheduling options of a report purges the report configuration variables and stops the report process
The history retention period can be set using a configuration variable. The default collection (retention) period is one day. Whenever a stored parameter value exceeds its retention period, it is automatically deleted from the parameter history file. Refer to the BMC user documentation for details.
Running PSL Commands With Agent Queries
This chapter explains how to run PSL commands on PATROL Agents by using the Agent Query Tool for operations that cannot be performed from the standard TrueSight user interface.
To perform an Agent Query
- In the navigation pane of the TrueSight console, click Configuration and select Managed Devices.
- Click a PATROL Agent menu

- In the Command box, specify the query and click Execute.

Available PSL Commands
All text arguments should be delimited by quotes (ex: “text argument”). If a backslash character (\) is used, it must be doubled (ex: \\).
about()
requires MS_HW_q; about();
This command returns information that help precisely identify the Hardware Sentry KM version in use.
acknowledge()
requires MS_HW_q; acknowledge(devicePath);
This command acknowledges alerts for the selected device. The following argument is required:
- devicePath: The device path is composed of:
/<class name>/<PATROL ID>.
classReport()
requires MS_HW_q; classReport(objectType/classname,hostID);
This command displays the list of devices for the specified object type/class. The following arguments can be used:
- objectType/classname: Object type or class name for which instances should be listed (Battery, Blade, CPU Core, Connector, Disk Controller, Enclosure, Fan, LED, LUN, Logical Disk, Memory Module, Network Interface, Other Device, Physical Disk, Power Supply, Processor, Robotics, Tape Library, Temperature, Voltage).
- hostID: Host PATROL ID. When the hostID is provided, this command reports instances of the class for the specified host. If left empty, it reports all instances.
dumpNamespace()
requires MS_HW_q; dumpNamespace(filename);
This command reports on the product namespace information. The following argument can be used:
- filename: Path to the filename on the PATROL Agent where the report will be saved. If not provided, this command displays the report in the Agent Query window.
pause()
requires MS_HW_q; pause(devicePath);
This command pauses the monitoring of a device. The following argument is required:
- devicePath: The device path is composed of:
/<class name>/<PATROL ID>.
productReport()
requires MS_HW_q; productReport(filename);
This command generates the product report information (Product version, KM version, libraries and connectors, etc.). The following argument can be used:
- filename: Path to the filename on the PATROL Agent where the report will be saved. If not provided, this command displays the report in the Agent Query window.
rediscover()
requires MS_HW_q; rediscover(hostID);
This command rediscovers a host by deleting all its related objects (including the missing ones) and performs a new discovery. The following argument is required:
- hostID: Host PATROL ID.
refresh()
requires MS_HW_q; refresh(hostID, objectType/classname);
This command refreshes the parameters by performing a collect of the provided object type for the specified host. The following arguments are required:
- hostID: Host PATROL ID.
- objectType/classname: Object type or class name to be refreshed (Battery, Blade, CPU Core, Connector, Disk Controller, Enclosure, Fan, LED, LUN, Logical Disk, Memory Module, Network Interface, Other Device, Physical Disk, Power Supply, Processor, Robotics, Tape Library, Temperature, Voltage).
reinitialize()
requires MS_HW_q; reinitialize(useDefault, resetSecuritySettings, resetPreselectedConnectors, resetDebugMode, resetThresholds, resetRemovedPausedObjectList, resetAlertActions, resetOtherAlertSettings, resetReportSettings, resetLocalhostMonitoring, resetJavaSettings, resetAlertAfterNTimes, resetAdvancedVariableList);
This command reinitializes the monitoring solution and performs a new discovery. The following arguments can be used:
- useDefault: Set to ‘1’ to use the default reinitialize settings (resetThresholds, resetRemovedPausedObjectList and resetPreselectedConnectors). Set to ‘0’ or leave empty to provide the following additional arguments.
- resetSecuritySettings: Set to ‘1’ to remove localhost security settings (usernames, passwords, SNMP community, sudo information, etc.)
- resetPreselectedConnectors: Set to ‘1’ to remove the list of pre-selected connectors for the localhost. A new detection of connectors will be performed.
- resetDebugMode: Set to ‘1’ to turn off the debug mode.
- resetThresholds: Set to ‘1’ to delete all product thresholds and collect intervals from the configuration. The discovery sets default thresholds back.
- resetRemovedPausedObjectList: Set to ‘1’ to remove the list of paused objects and the list of deleted objects.
- resetAlertActions: Set to ‘1’ to remove any existing alert action and set the default ones (Trigger a PATROL Event and Annotate the parameter's graph).
- resetOtherAlertSettings: Set to ‘1’ to set the default settings for missing objects, intrusion detection, error messages, unexpected status management and Error Count parameters reset
- resetReportSettings: Set to ‘1’ to delete all report scheduling settings.
- resetLocalhostMonitoring: Set to ‘1’ to enable the localhost monitoring if it has been disabled.
- resetJavaSettings: Set to ‘1’ to reset Collection Hub settings. An automatic detection of Java will be performed.
- resetAlertAfterNTimes: Set to ‘1’ to remove all N Times settings and updates existing thresholds with the default N Time value.
- resetAdvancedVariableList: List of variables, separated by carriage return, that should be deleted from the configuration.
removeDevice()
requires MS_HW_q; removeDevice(devicePath);
This command removes a device from your monitored environment. The following argument is required:
- devicePath: Full path to the device to remove.
removeMissing()
requires MS_HW_q; removeMissing();
This command removes missing devices.
restoreDevice()
requires MS_HW_q; restoreDevice(devicePath);
This command restores the monitoring of a previously removed device. The following argument is required:
- devicePath: Full path to the device to restore.
You can use “all” to restore all currently removed devices (ex: requires MS_HW_q; restore("all");).
resume()
requires MS_HW_q; resume(devicePath);
This command resumes the monitoring of a device. The following argument is required:
- devicePath: Full path to the device to resume.
You can use “all” to resume the monitoring of all currently paused devices (ex: requires MS_HW_q; resume("all");).