|
The Database Query Analysis tool executes SQL queries on the most popular database servers currently available on the market (Microsoft SQL, MySQL, Oracle and PostgreSQL) and monitors their return output within your PATROL environment. You can then run string or numeric value searches on the return output to monitor the result in myriad ways. You do not need to run separate SQL queries any longer.
If the application you wish to monitor uses a database server, you can test this database by sending applicative queries to the database server, or by testing the content of some critical application tables. Once you specify an SQL query, you can search for strings in the result set and build graphs using the numerical values returned. Queries can be set up to perform complex tasks with just the click of a button, and they can be saved for future use.
As query results are stored by Monitoring Studio in a pipe-separated table format, it is easy to specify strings to be searched or numeric values to be extracted from a database query. Please refer to the string search and numeric value extraction sections for more information.
Example
How the database query result is formatted and then searched for strings and numeric values:

|
Database query analysis objects are instances of the SW_DB_QUERIES class.
Creating a Database Query Analysis
| 1. | In the PATROL Console, right-click the Monitored Application icon and select KM Commands > New > Database Query analysis… |
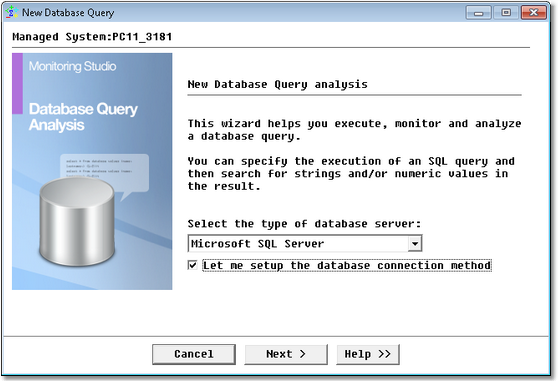
Database Query Analysis Wizard — Welcome Page
| 2. | Select the Database type: |
| ▪ | Select the database used by your application among the options available (Microsoft SQL Server, MySQL Server, Oracle Database Server, Other, or PostgreSQL). |
| ▪ | Check the box Let me setup the database connection method if you want to manually select the connection method to be used to access the database. A list of available connection methods will be displayed in the next dialog box. |
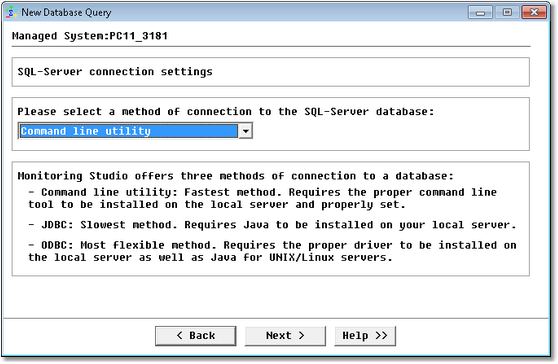
Database Query Analysis Wizard — Database Connection Method Selection
| 4. | Select the connection method: |
| ▪ | Command line utility: Select this option to use the command line tool developed by the database provider to manage access to a database. This method is by far the fastest but requires the command line tools to be installed on the local server and properly set. These command line tools are: |
| ▪ | Microsoft SQL Server: OSQL |
| ▪ | Oracle Database Server: Oracle SQL*Plus |
| ▪ | Java Database Connectivity (JDBC): Select this option to use JDBC to perform the query to the database. This method is the slowest and requires Java to be installed on your local server. |
| ▪ | Open Database Connectivity (ODBC): Select this option to use ODBC to perform the query to the database. This method is known as the most flexible. However, it requires the proper driver to be installed on the local server as well as Java for UNIX/Linux servers. |
 Additional information: Additional information:
| ✓ | SQL queries on Oracle Database running on Windows servers can only be performed locally with the ODBC connection method; for UNIX, SQL queries are not limited to the local host but a specific driver must be installed on the server where the agent is running. |
| ✓ | Performing an SQL Query on a Microsoft SQL database installed on a UNIX Server is only possible with JDBC and ODBC connection methods since Microsoft does not provide OSQL for UNIX. |
| 5. | If JDBC is selected and Java is not detected on the server, Monitoring Studio will ask you to provide the Java path. |
| 6. | Click Next. The next steps will depend on the database server and the connection method selected: |
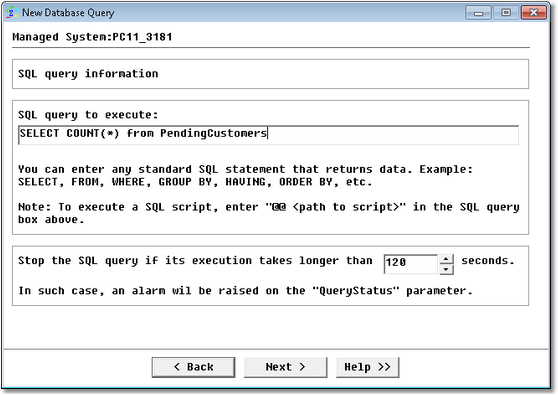
Database Query Analysis Wizard — Query Definition Page
| 8. | Define the query to be executed. |
| ▪ | SQL Query to execute: Single line SQL statement to be executed by the server. This also can be the path to an existing SQL script file. Use the following syntax if you want to execute the SQL query from a file: "@@ <file name>" (only supported by the Command Line connection method). |
| ▪ | Query timeout: Time in seconds after which the ConnectionStatus parameter goes into alert. |
Example
| • | Oracle service name: BACKENDDB |
| • | SQL query: SELECT COUNT(*) FROM PendingCustomers |
| • | Behavior: Will connect to the BACKENDDB Oracle server instance using the sysApp database account and ask the server to return the number of rows in the Pending Customers table. This query should give a number representing the number of waiting customers for the application. |
|
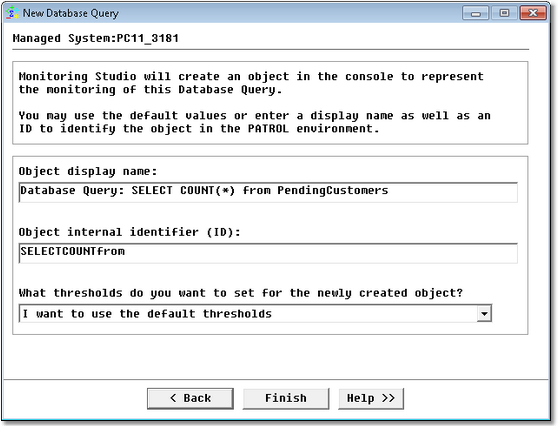
Database Query Analysis Wizard — Settings Page
See Also
Numeric Value Extraction
String Search
Dynamic Object Builder
SW_DB_QUERIES
| 

