-
Home
- Studio Monitors with Content 11
Database Query (SQL)
The Database Query Monitor lets you execute an SQL statement against a database server to:
- check the availability of the database
- check the result of a specific query
- extract data of interest for monitoring.
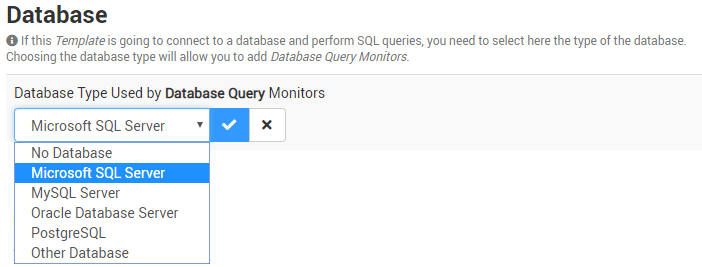
The most popular database servers are supported out-of-the-box (Microsoft SQL Server, MySQL, Oracle, IBM Informix and PostgreSQL), but any JDBC-enabled database can be supported as well.
To be able to execute SQL queries with Monitoring Studio X, you have to:
-
indicate at the Template level the type of database used:
-
click the Database Query button to specify the SQL query to be run.
A Template can only connect to and monitor one single database.The database-specific information, like the port, will have to be specified in the Host page when applying the Template to the Host.

When the query is successfully executed, Monitoring Studio X can provide its execution time, result, and status.
The result, which is stored by Monitoring Studio X in a pipe-separated table format, can be analyzed through a wide range of tools (Dynamic Object, Numeric Value Extraction, Text Pre-Processing, String Search, and Value Map).
Refer to the table below to know how to configure the Database Query Monitor:
| Property | Description | |
|---|---|---|
| SQL Query | SQL query to be executed. | |
| Execute As | Credentials required to execute the SQL query. By default, System Credentials are used. | |
| Timeout After | Time in seconds after which the request will be stopped (Default: 30 seconds). If the SQL query times out, the Status parameter of the Monitor will be set to 2 (Failed) and an alarm will be triggered, or the Template's Collection Error Count will be increased by ‘1’. | |
| Display Name | Name to identify the SQL Monitor instance in BMC TrueSight/Helix Operations Management. | |
| Internal ID | ID to be used to store the SQL Monitor configuration in the PATROL Agent configuration. This Internal ID is automatically generated based on the Display Name provided but can be edited if needed. | |
| Collect Schedule | How often new data is collected. A new collect can be performed from once every second, to once in a day. By default, the collect schedule is set to 2 minutes. |
Once you are done with the configuration, you can run a Dry Run to simulate the execution of this Monitor on a specific host and therefore verify that the output is conform to the expected result.
Finally, you can define where alerts are reported, the threshold alert values, and the alert severity levels for the Monitor:
-
Indicate if you want Monitoring Studio X to report Monitor Errors in The Monitor's Status Parameter or The Template's Collection Error Count Parameter (default).
-
Then, for each parameter, define up to three alarm ranges (Alarm #1, Alarm #2 and Out-of-range) each with a minimum and a maximum value:
- Use the Alarm #1 and Alarm #2 options to define the range of parameter values that triggers warnings and alarms.
- Use the Out-of-range border conditions to be informed when the collected values are outside the norm (less than or greater than the defined range limits).
Refer to the Configuring Alerts for details and to Studio Database Query for more information about the parameters available and the thresholds set by default.