-
Home
- Integrations Prometheus 3
Exposing Parameters in Prometheus
Monitoring Studio X provides a PATROL Agent Exporter for Prometheus that can be easily integrated into the Prometheus ecosystem. The exporter scrapes the PATROL Agent numeric parameters and exposes them to Prometheus as standard metrics.
The PATROL Agent Exporter for Prometheus relies on the Prometheus pull method. The job name is “patrol”.
Configuring the Prometheus Integration
To expose PATROL numeric parameters in Prometheus, you must:
- Install and configure your Prometheus ecosystem. Refer to the Prometheus User Documentation for more details
- Configure the Prometheus server to pull the information from Monitoring Studio X
- Enable the PATROL Agent Exporter in Monitoring Studio X.
Configuring the Prometheus Server
To configure the Prometheus server to pull information from Monitoring Studio X, update the prometheus.yml configuration file with the following information:
scrape_configs:
- job_name: 'patrol'
    scrape_interval: 1m
    scrape_timeout: 15s
    static_configs:
    - targets: ['<Monitoring Studio X Prometheus exporter url>']
    scheme: https
    tls_config:
    insecure_skip_verify: true
Enabling the Prometheus Exporter
From the Monitoring Studio X Web interface:
-
Go to Agent > Prometheus Exporter
-
Enable the Prometheus Exporter
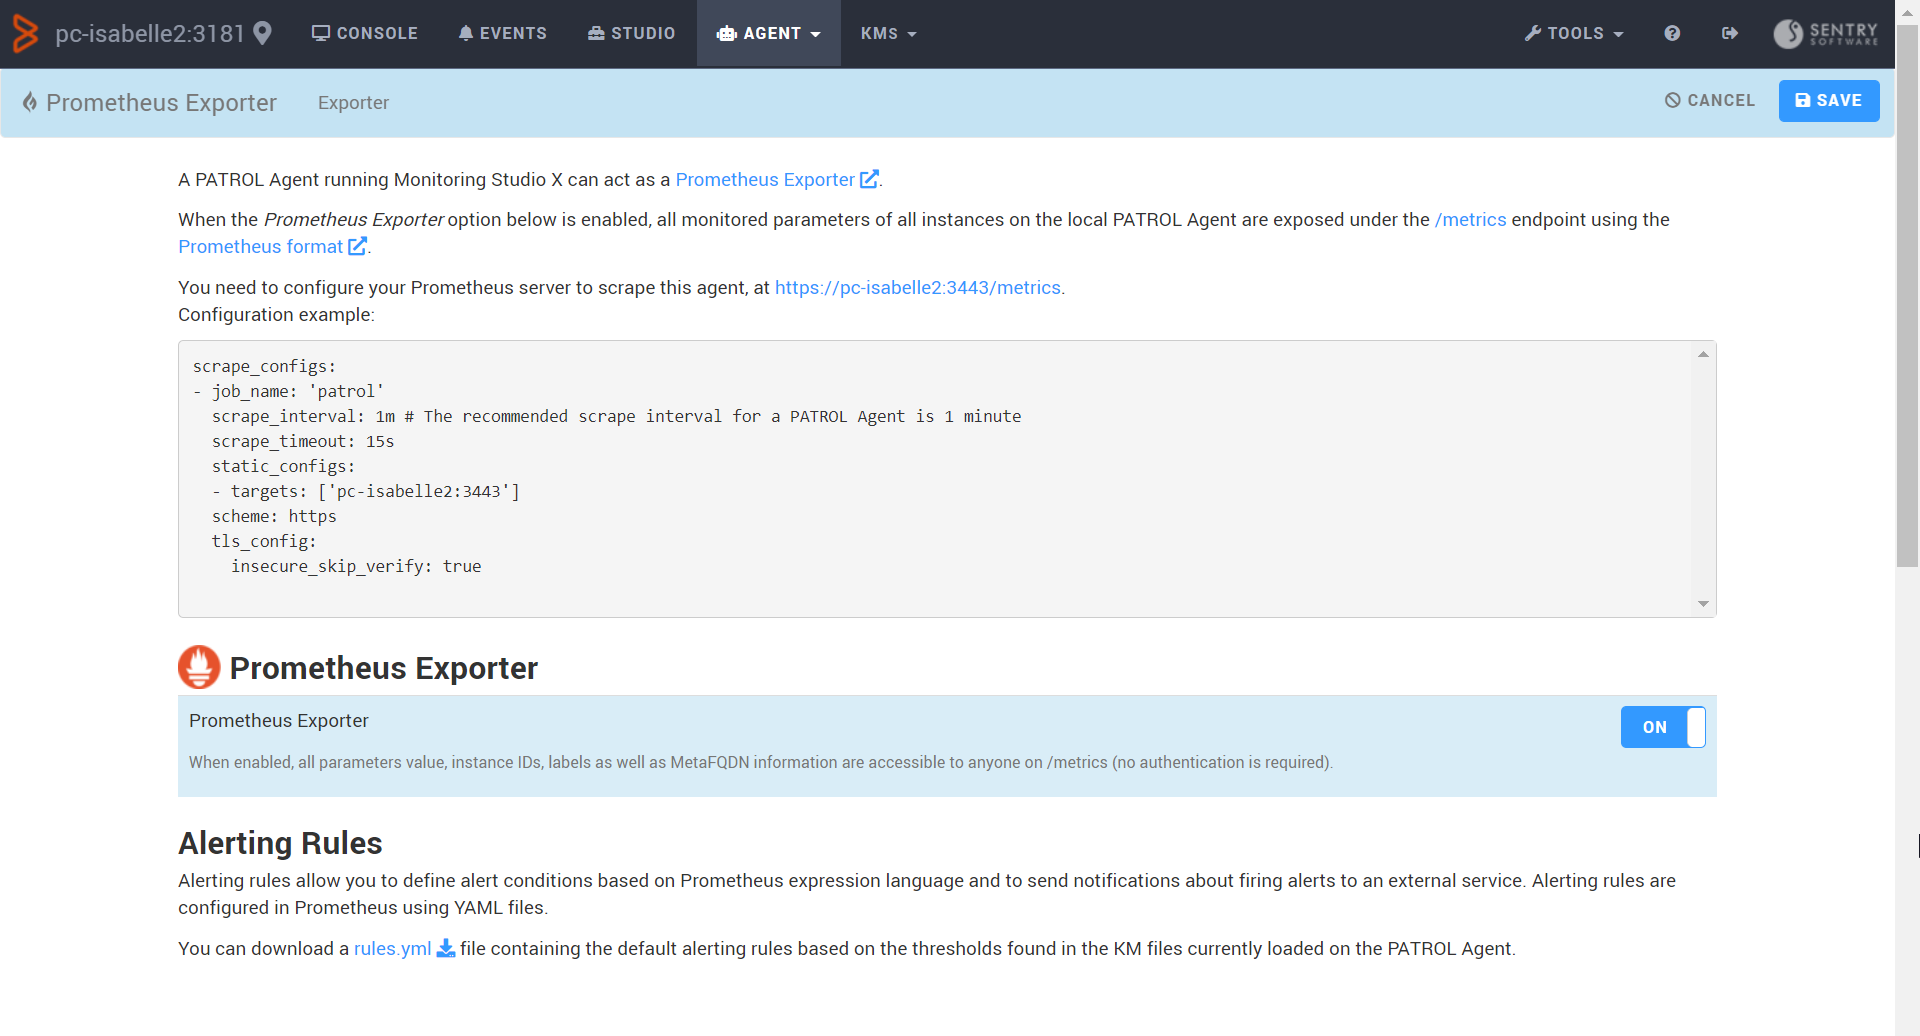
-
Click Save.

All active numeric parameters of all loaded KMs will be scraped, documented and populated by the PATROL Agent Exporter for Prometheus. Text parameters and collectors are ignored.
Accessing the Exported Data
To access the exported data, connect to https://<hostname>:<port>/metrics, using the Monitoring Studio X hostname and port (Example: https://myhostname:3443/metrics):

Data can also be accessed from the Monitoring Studio X Web interface by clicking the link provided in the Agent > Prometheus Exporter page:

Metrics are exposed as follows:
# HELP <metric name> metric: <parameter name> - unit: <unit>
# TYPE <metric name> gauge`
<metric name>{id=\"<instance ID>",label="<instance label>",parent="< parent path>",fqdn="host FQDN>"} <parameter value> <collect time>
The <metric name> provides the application class, parameter, and unit. Example: The Read Byte Rate parameter of the SKM Volume application class expressed in bytes per second is exposed in Prometheus as skm_volume_readrate_bytes_per_second:
# HELP skm_volume_readrate_bytes_per_second metric: Read Byte Rate - unit: bytes_per_second
The unit is not exposed in Prometheus if the PATROL unit contains non-alphabetical characters. Example: The Status parameter of the MS_HW_BATTERY application class for which the unit is {0 = OK ; 1 = Degraded ; 2 = Failed} is exposed in Prometheus as ms_hw_battery_status:
# HELP ms_hw_battery_status metric: Status - unit: {0 = OK ; 1 = Degraded ; 2 = Failed}
The metric TYPE is always gauge.
# TYPE ms_hw_battery_status gauge
The following labels are also provided:
- id: PATROL ID of the instance to which the parameter is attached
- label: name of the PATROL instance to which the parameter is attached
- parent: path to the parent instance
- fqdn: FQDN of the host to which the instance is associated
- parameter value: value of the scraped parameter
- collect time: time at which the parameter was collected (if enabled)
ms_hw_battery_status{id="MS_HW_EMCDiskArrayhdfdev-hv-01SKM_SYMMETRIX--000297800620SB-1--SPS-3AAggregate",label="SB-1-+-SPS-3A (Aggregate)",parent="/MS_HW_BATTERY_CONT/Container_MS_HW_ENCLOSUREMS_HW_EMCDiskArrayhdfdev-hv-01SKM_1_000297800620",fqdn="000297800620"} 0 1621867085
The exporter also reports the scraped status (0 = failed, 1 = success) and the time taken to gather the data at the end of the scraped information:
patrol_up 1
patrol_scrape_duration_seconds 2
Converting KMs Parameters Units to Base Units
When using Prometheus, the use of base units such as bytes, seconds, fractions, watts, etc. should always be preferred. To follow this best practice and make widely used parameters consistent, Monitoring Studio X automatically converts the parameters units of the following KMs to base units:
-
Sentry Software's KMs:
- Hardware Sentry
- HP Data Protector
- Monitoring Studio X
- Storage Analyzer
- Veritas Cluster Server
- Veritas NetBackup
- Veritas Volume Manager
-
BMC Software's KMs:
- BMC PATROL for AIX
- PATROL for Linux
- PATROL for Microsoft Windows Servers
- PATROL for Solaris
- PATROL for UNIX and Linux
The value of each parameter is converted using a factor and the metric name is updated accordingly. The Read Byte Rate parameter of the SKM Volume application class is for example exposed in MB/s in Monitoring Studio X but exposed in bytes per second and named skm_volume_readrate_bytes_per_second when exported to Prometheus.
To overwrite the automatic conversion or convert other parameters units to base units:
-
Open the X_patrol2prometheus.csv file stored in %PATROL_HOME%\lib or $PATROL_HOME/lib
-
Add the following line for each parameter to be converted:
PATROL Class,PATROL Parameter,Prometheus Parameter,Prometheus Unit,FactorExample:
MS_HW_LOGICALDISK,UnallocatedSpace,UnallocatedSpace,bytes,1073741824
-
(Optional) Comment your work using the
#character.

Configuring Alerting Rules
To define alert conditions, you need to configure alerting rules in Prometheus using YAML files. The rules.yml file available to download from the Monitoring Studio X interface, under Agent > Prometheus Exporter > Alerting Rules, contains the rules corresponding to the thresholds set for the loaded KMs.

You can modify these rules to meet your specific needs before adding them to Prometheus Alertmanager:

For more information about Prometheus alerting rules, refer to the Prometheus User Documentation.